Restaurant data

In this tutorial, we’ll create a data pipeline that does the following:

  1. Load data from an online endpoint
  2. Visualize the data using charts
  3. Transform the data and create 2 new columns
  4. Write the transformed data to PostgreSQL

Setup

If you haven’t created a Mage project before, follow the setup guide before starting this tutorial.


1. Create new pipeline

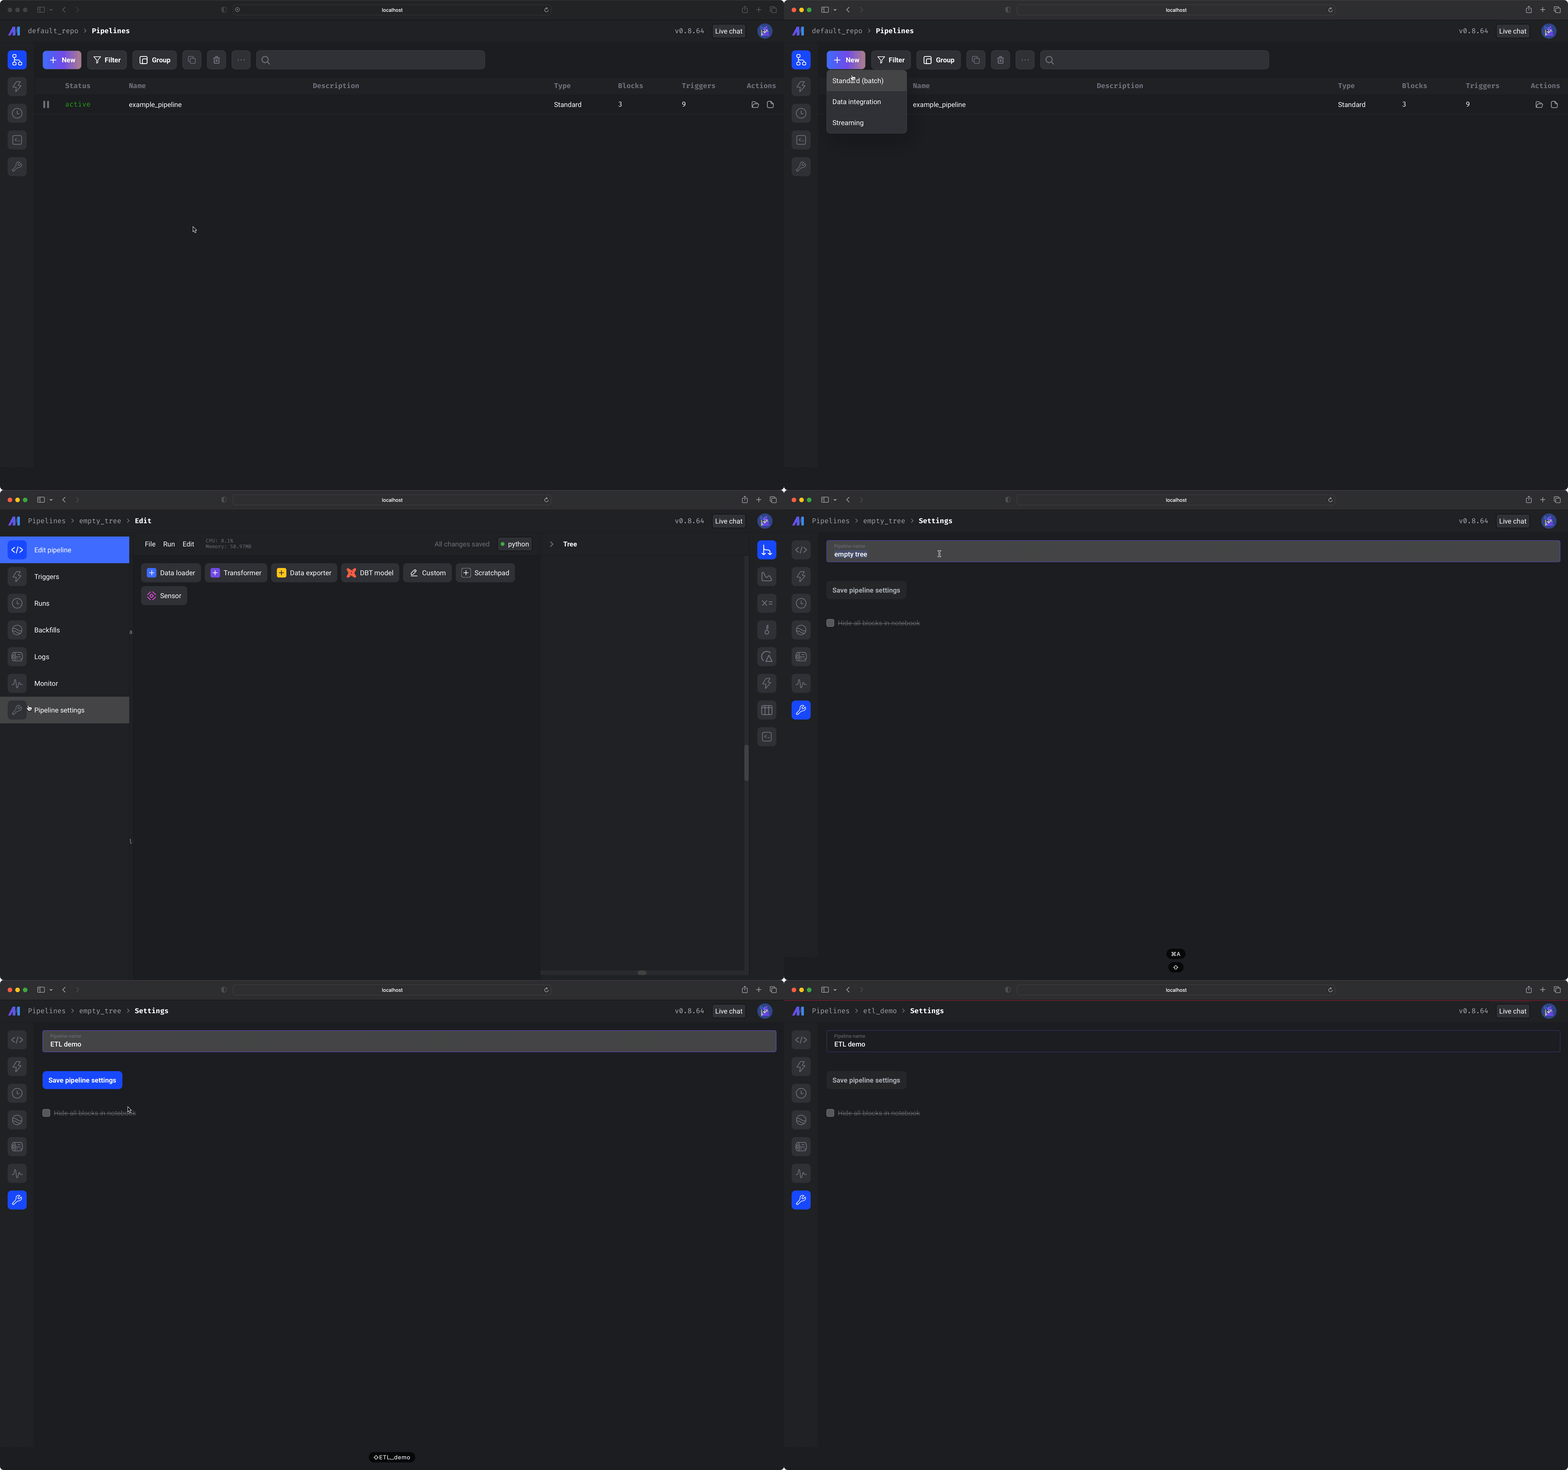
  1. Go to the pipelines list page (/pipelines). This is the default page when navigating to Mage in your web browser.
  2. In the top left corner of the page, click the button labeled + New, then select the option labeled Standard (batch) to create a new pipeline.
  3. In the left vertical navigation, click the last link labeled Pipeline settings.
  4. Change the pipeline’s name to ETL demo.
  5. Click the button labeled Save pipeline settings.
Create new pipeline

2. Load data from an API

  1. In the left vertical navigation, click the 1st link labeled Edit pipeline.

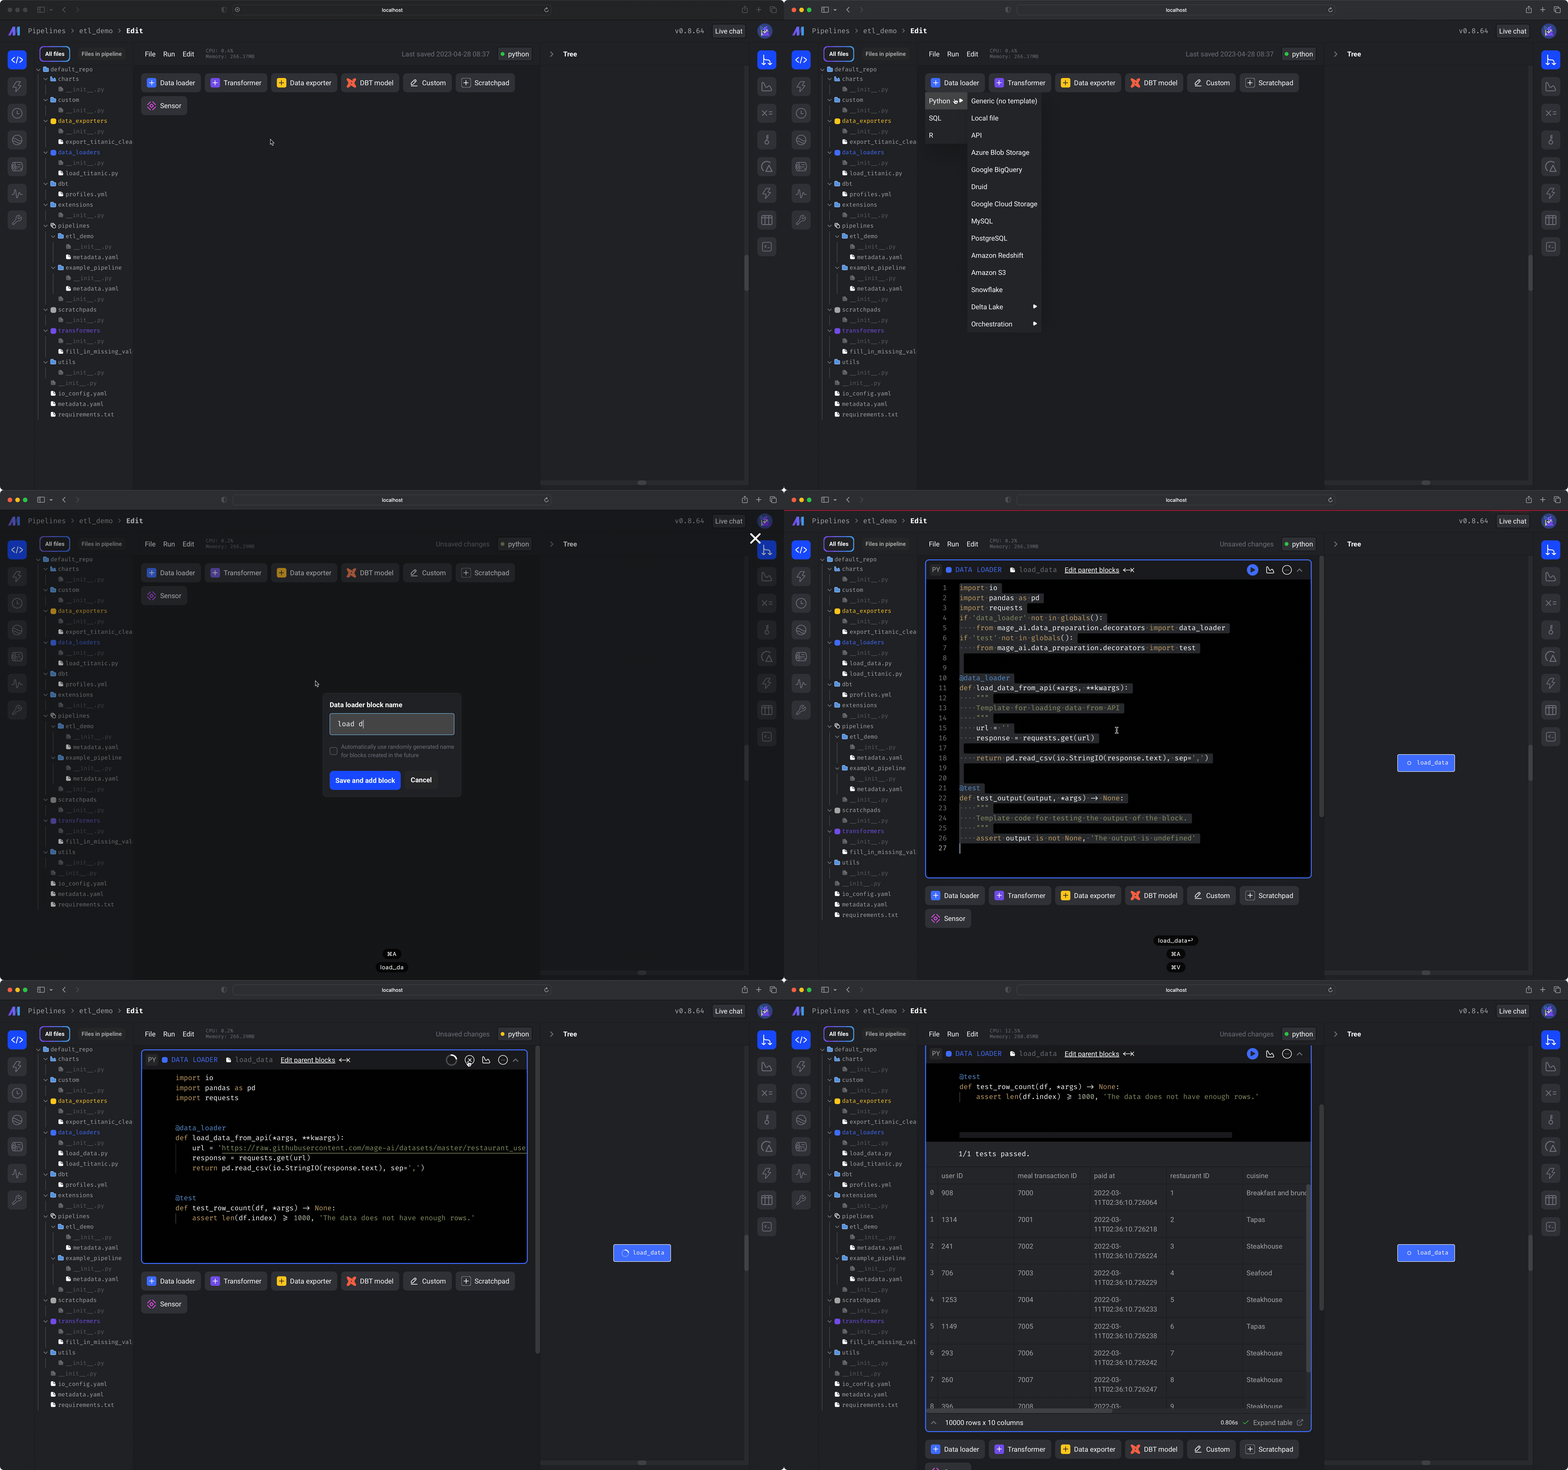
  2. Click the button labeled + Data loader, then hover over Python, and click the option labeled API.

  3. A dialog menu will appear. Change the block name to load data.

  4. Click the button labeled Save and add block.

  5. Paste the following code in the data loader block:

    import io
    import pandas as pd
    import requests
    
    
    @data_loader
    def load_data_from_api(*args, **kwargs):
        url = 'https://raw.githubusercontent.com/mage-ai/datasets/master/restaurant_user_transactions.csv'
        response = requests.get(url)
        return pd.read_csv(io.StringIO(response.text), sep=',')
    
    
    @test
    def test_row_count(df, *args) -> None:
        assert len(df.index) >= 1000, 'The data does not have enough rows.'
    
  6. Run the block by clicking the play icon button in the top right corner of the data loader block or press 1 of the following keyboard shortcuts:
    • ⌘ + Enter
    • Control + Enter
    • Shift + Enter
  7. After you run the block (⌘ + Enter), you’ll see a sample of the data that was loaded.

    Load data

3. Visualize data

3a. Distribution of ratings

We’ll add a chart to visualize how frequent people give 1 star, 2 star, 3 star, 4 star, or 5 star ratings.

  1. In the top right corner of the data loader block, click the charts icon.
  2. In the dropdown menu, select the option labeled Histogram. This will add a new chart block in the right side of the page (aka the sidekick).
  3. Click the pencil icon in the top right corner of the chart block to edit the chart.
  4. In the dropdown menu labeled Number column for chart, select the option for column rating.
  5. Click the play button icon in the top right corner of the chart block to run the chart.
  6. The chart should look like this:
    Distribution of ratings

3b. Number of meals per user

Let’s add another chart to see how many meals each user has.

  1. In the top right corner of the data loader block, click the charts icon.
  2. In the dropdown menu, select the option labeled Bar chart. This will add a new chart block in the right side of the page (aka the sidekick).
  3. Click the pencil icon in the top right corner of the chart block to edit the chart.
  4. In the dropdown menu labeled Group by columns, select the option for column user ID.
  5. Under the Metrics section:
    1. In the dropdown menu labeled aggregation, select the option for count_distinct.
    2. In the dropdown menu labeled column, select the option for column meal transaction ID.
  6. Click the play button icon in the top right corner of the chart block to run the chart.
  7. The chart should look like this:
    Number of meals per user

4. Transform data

Let’s transform the data in 2 ways:

  • Add a column that counts the number of meals for each user.
  • Clean the column names to properly store in a PostgreSQL database.

Follow these steps:

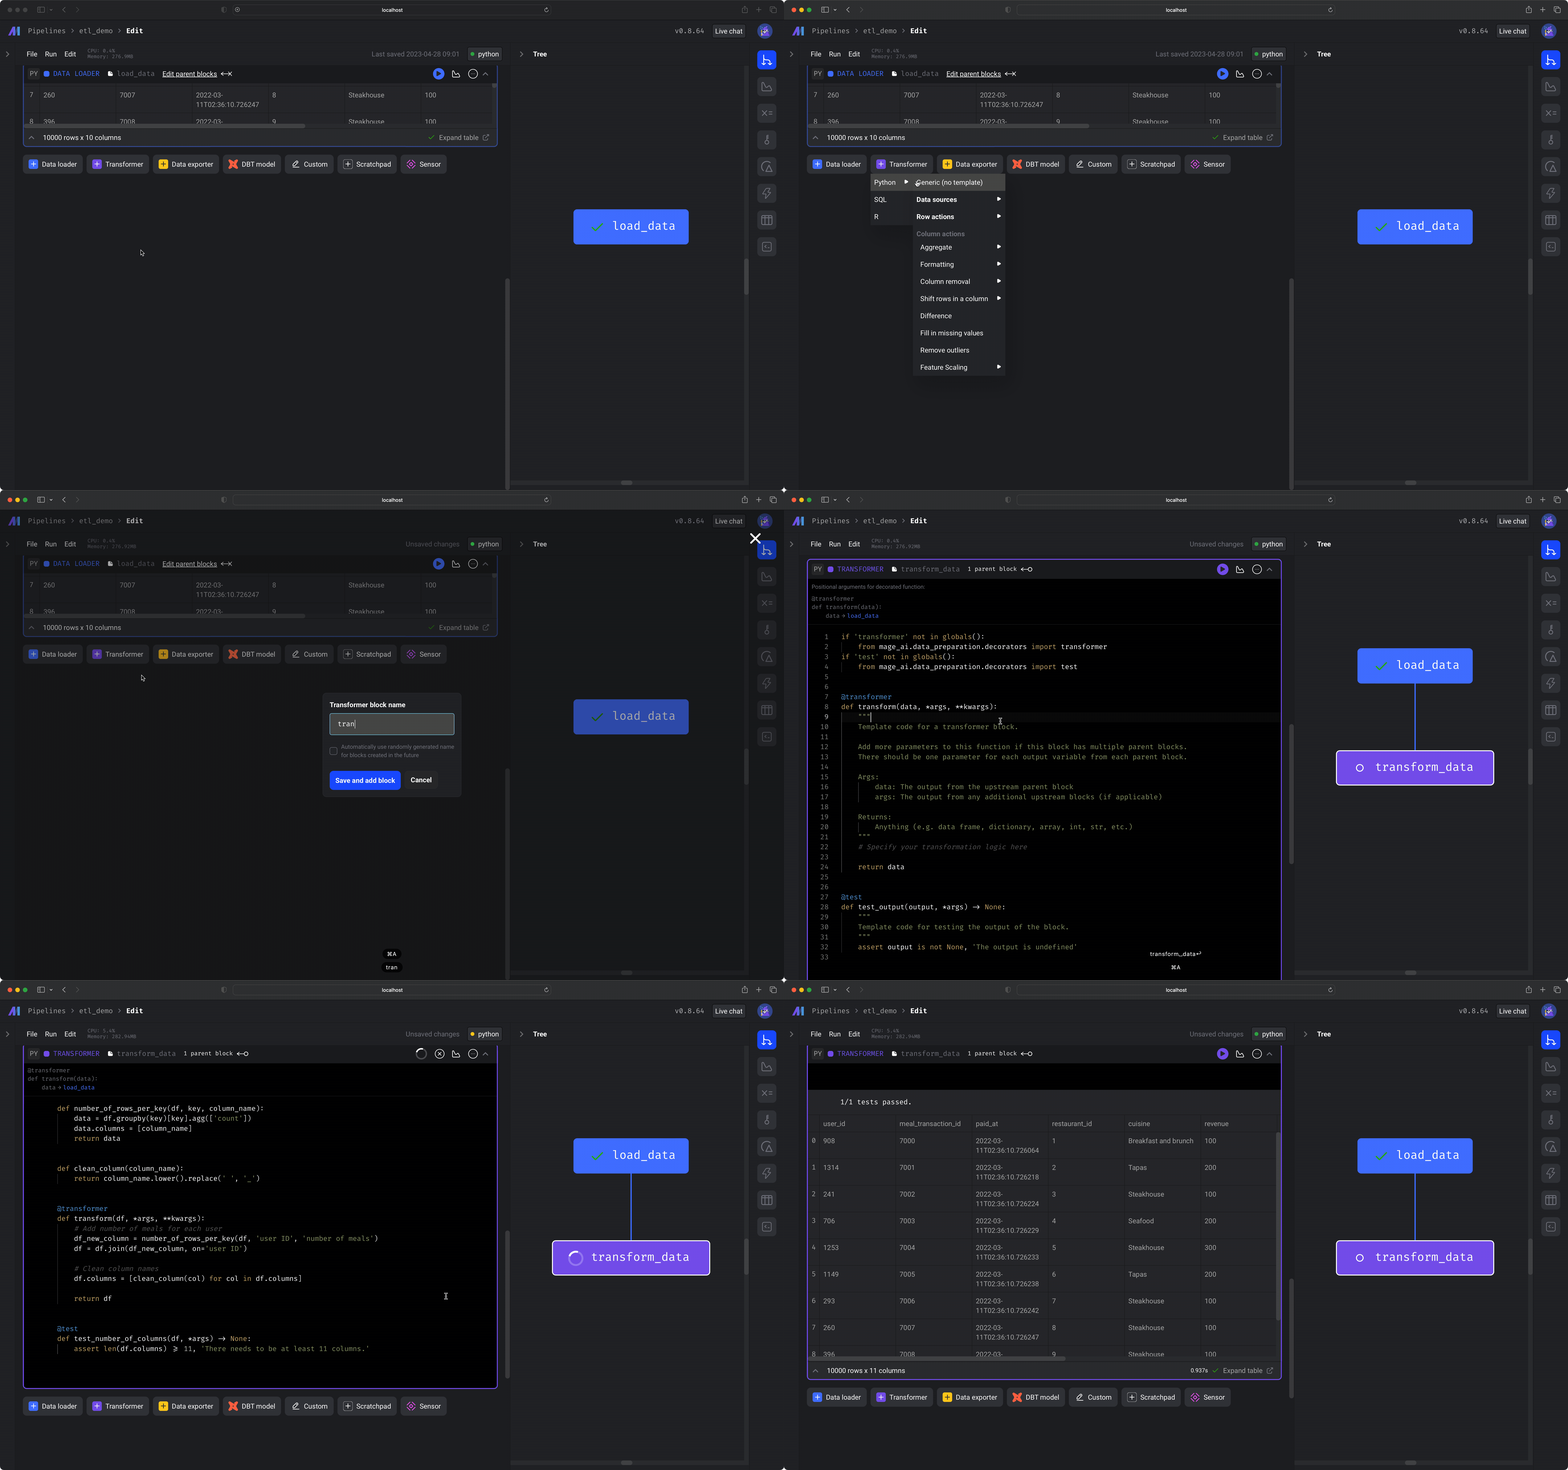
  1. Click the button labeled + Transformer, then hover over Python, and click the option labeled Generic (no template).

  2. A dialog menu will appear. Change the block name to transform data.

  3. Click the button labeled Save and add block.

  4. Paste the following code in the transformer block:

    def number_of_rows_per_key(df, key, column_name):
        data = df.groupby(key)[key].agg(['count'])
        data.columns = [column_name]
        return data
    
    
    def clean_column(column_name):
        return column_name.lower().replace(' ', '_')
    
    
    @transformer
    def transform(df, *args, **kwargs):
        # Add number of meals for each user
        df_new_column = number_of_rows_per_key(df, 'user ID', 'number of meals')
        df = df.join(df_new_column, on='user ID')
    
        # Clean column names
        df.columns = [clean_column(col) for col in df.columns]
    
        return df.iloc[:100]
    
    
    @test
    def test_number_of_columns(df, *args) -> None:
        assert len(df.columns) >= 11, 'There needs to be at least 11 columns.'
    
  5. Run the block by clicking the play icon button in the top right corner of the data loader block or press 1 of the following keyboard shortcuts:

    • ⌘ + Enter
    • Control + Enter
    • Shift + Enter
  6. After you run the block (⌘ + Enter), you’ll see a sample of the data that was transformed.

    Transform data

5. Export data to PostgreSQL

5a. Add credentials

  1. On the left side of the screen in the file browser, click on the file named io_config.yaml.

  2. Then, paste the following credentials:

    version: 0.1.1
    default:
      POSTGRES_PORT: 5432
      POSTGRES_DBNAME: xyleviup
      POSTGRES_USER: xyleviup
      POSTGRES_PASSWORD: edSrMWH7Mww-lTKpp-jPHX9sYSNLy7LG
      POSTGRES_HOST: queenie.db.elephantsql.com
      POSTGRES_SCHEMA: elt_demo
    
  3. Save the file by pressing:

    • Clicking the button labeled Save file content
    • ⌘ + Enter
    • Control + Enter
  4. Close the file by pressing the X button on the right of the file name at the top of the screen or click the button labeled View pipeline to return to the ETL demo pipeline.

5b. Export data using SQL

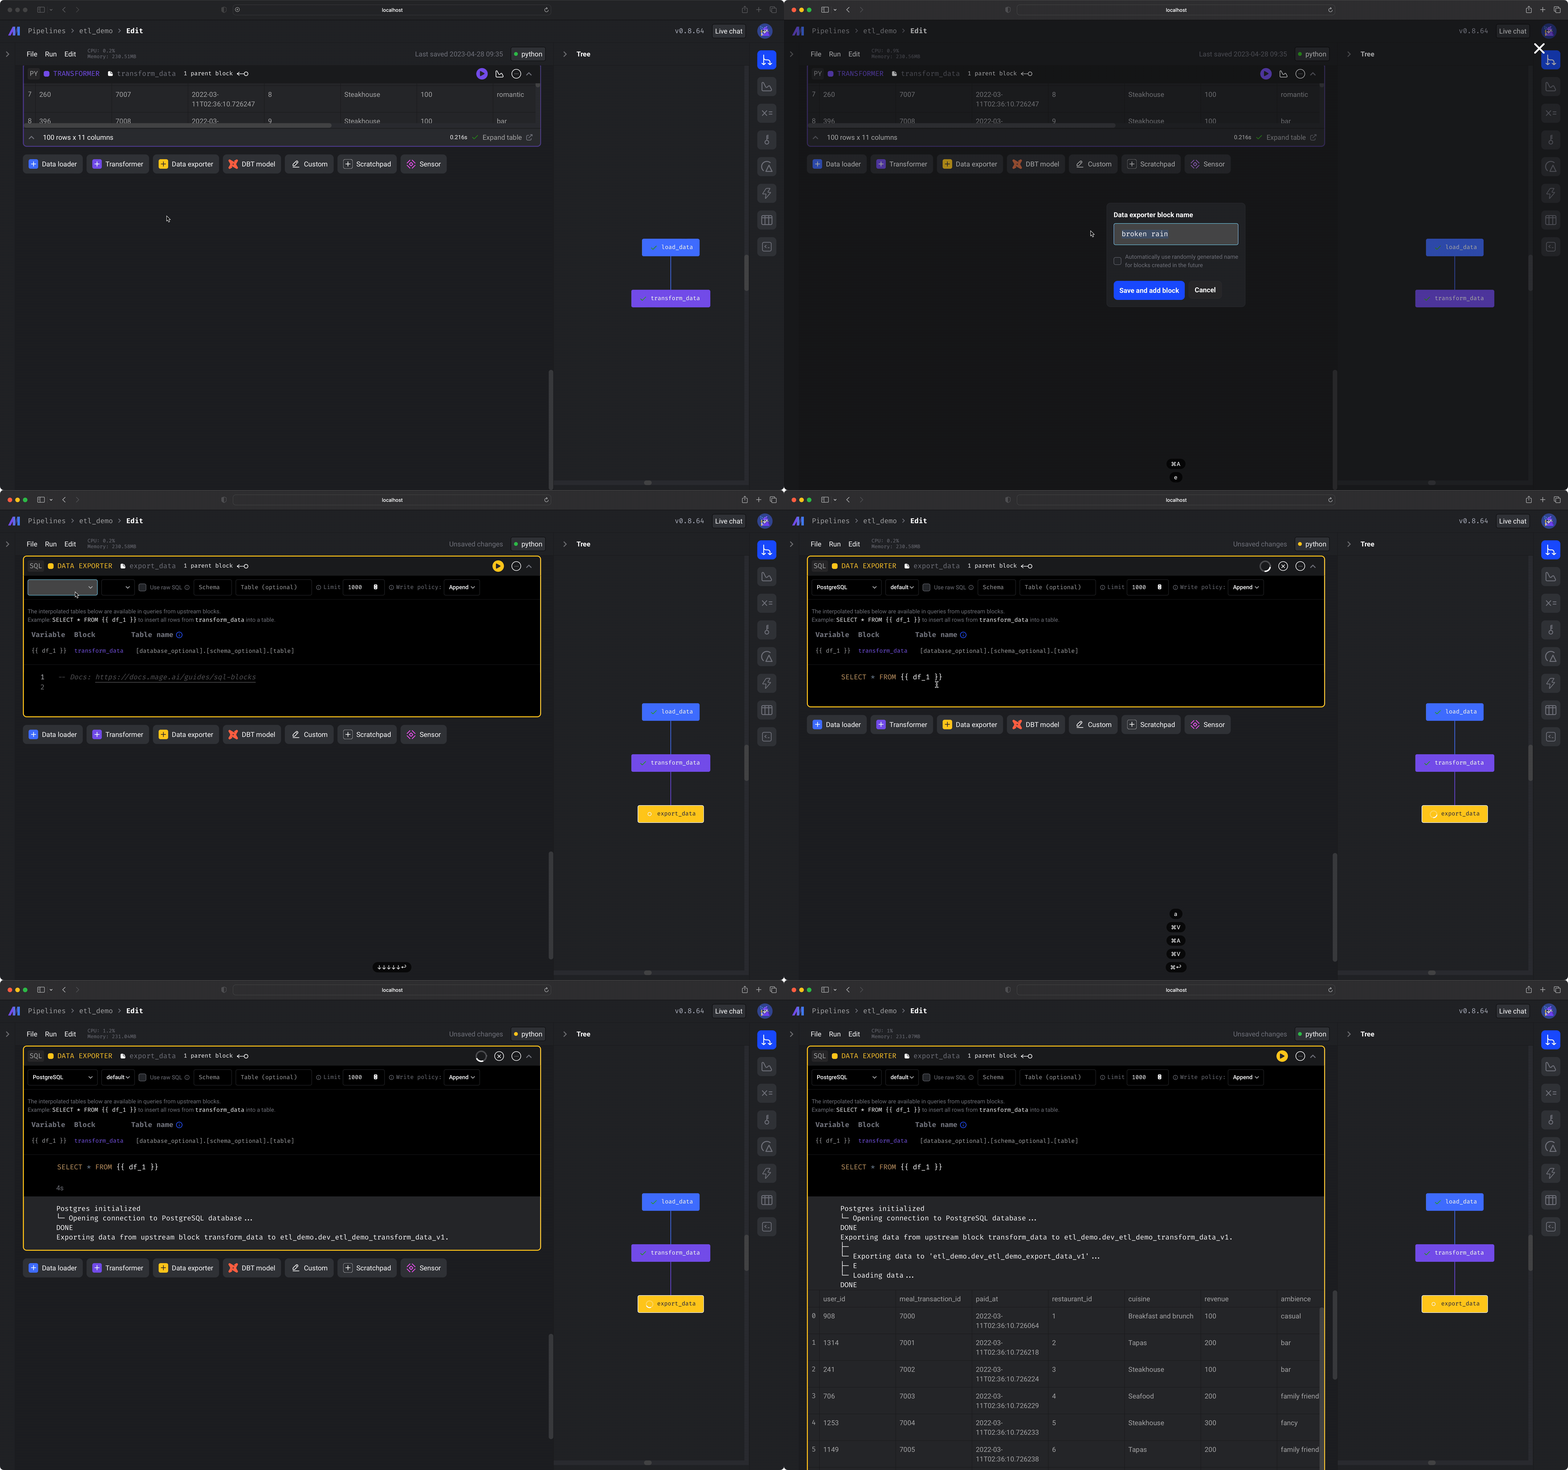
  1. Click the button labeled + Data exporter and then click the option labeled SQL.

  2. A dialog menu will appear. Change the block name to export data.

  3. Click the button labeled Save and add block.

  4. At the top of the block, in the 1st dropdown menu labeled Connection, select the option labeled PostgreSQL.

  5. At the top of the block, in the 2nd dropdown menu labeled Profile, select the option labeled default.

  6. At the top of the block, in the last dropdown menu labeled Write policy, select the option labeled Replace.

  7. Paste the following SQL statement in the data exporter block:

    SELECT * FROM {{ df_1 }}
    
  8. Run the block by clicking the play icon button in the top right corner of the data loader block or press 1 of the following keyboard shortcuts:

    • ⌘ + Enter
    • Control + Enter
    • Shift + Enter
  9. You should see output statements like this:

    Postgres initialized
    └─ Opening connection to PostgreSQL database...
    DONE
    Exporting data from upstream block transform_data to etl_demo.dev_etl_demo_transform_data_v1.
    ├─
    └─ Exporting data to 'etl_demo.dev_etl_demo_export_data_v1'...
    ├─ E
    └─ Loading data...
    DONE
    
  10. After you run the block (⌘ + Enter), you’ll see a sample of the data that was exported.
    Export data

🎉 Congratulations!

You’ve successfully built an end-to-end ETL pipeline that loaded data, transformed it, and exported it to a database.

Now you’re ready to raid the dungeons and find magical treasures with your new powers!

Lightning mage

If you have more questions or ideas, get real-time help in our live support Slack channel.