Chevron or Arrow looking icon to expand
the right panel and reveal the Sidekick.
Visualize block output data
Add 1 or multiple charts to visualize the data produced by a block. When viewing block output as a table in the Sidekick data view, click a column header to sort the preview or use the filter icon to narrow rows by column value. Sorting and filtering only change the current table preview; they don’t modify the block output saved by the pipeline.
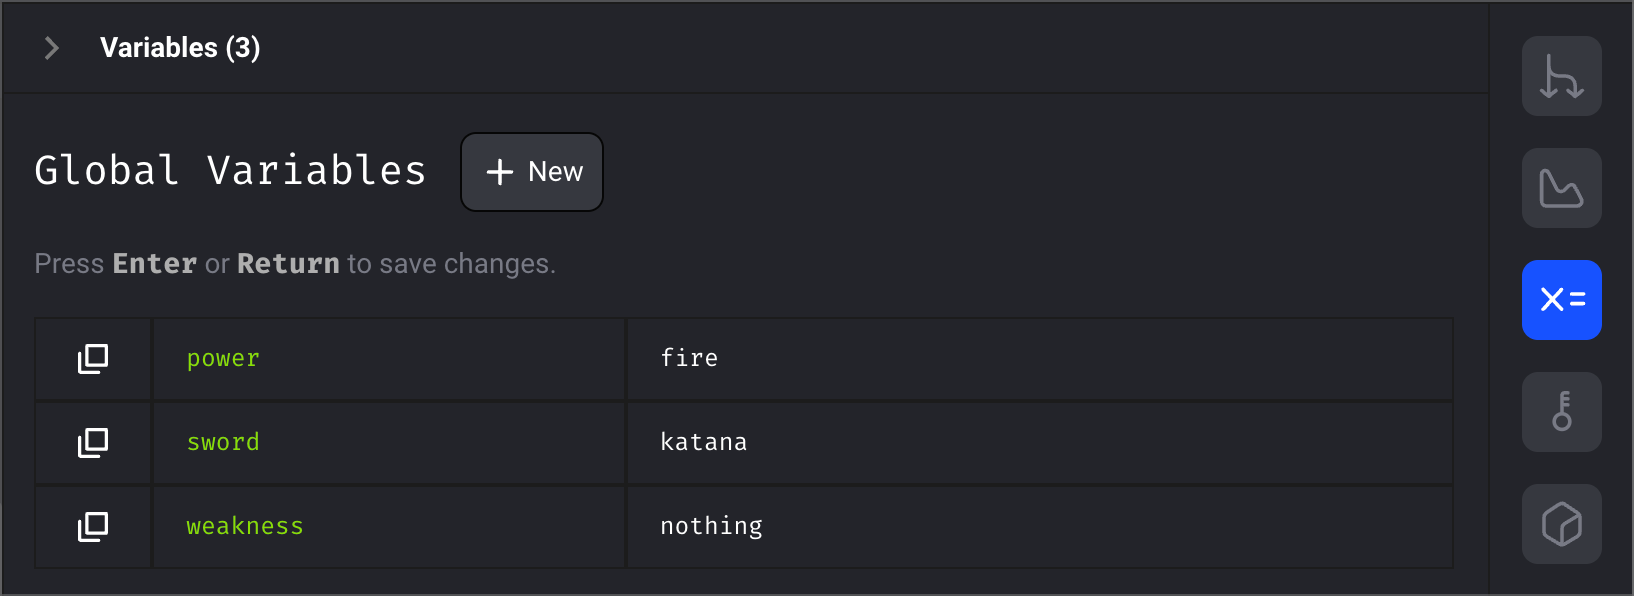
Configure pipeline variables
Store sensitive secrets
Secrets don’t make friends… but they save companies from oblivion.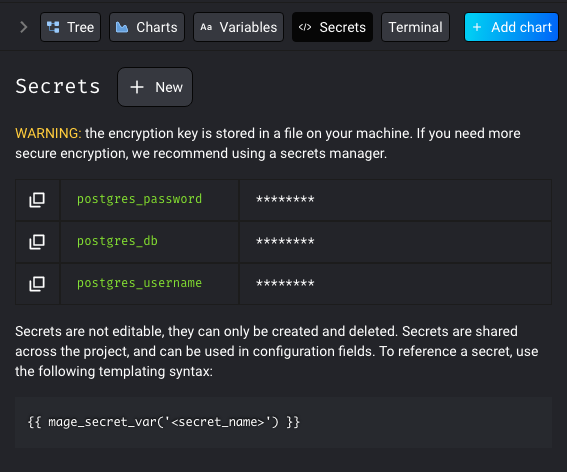
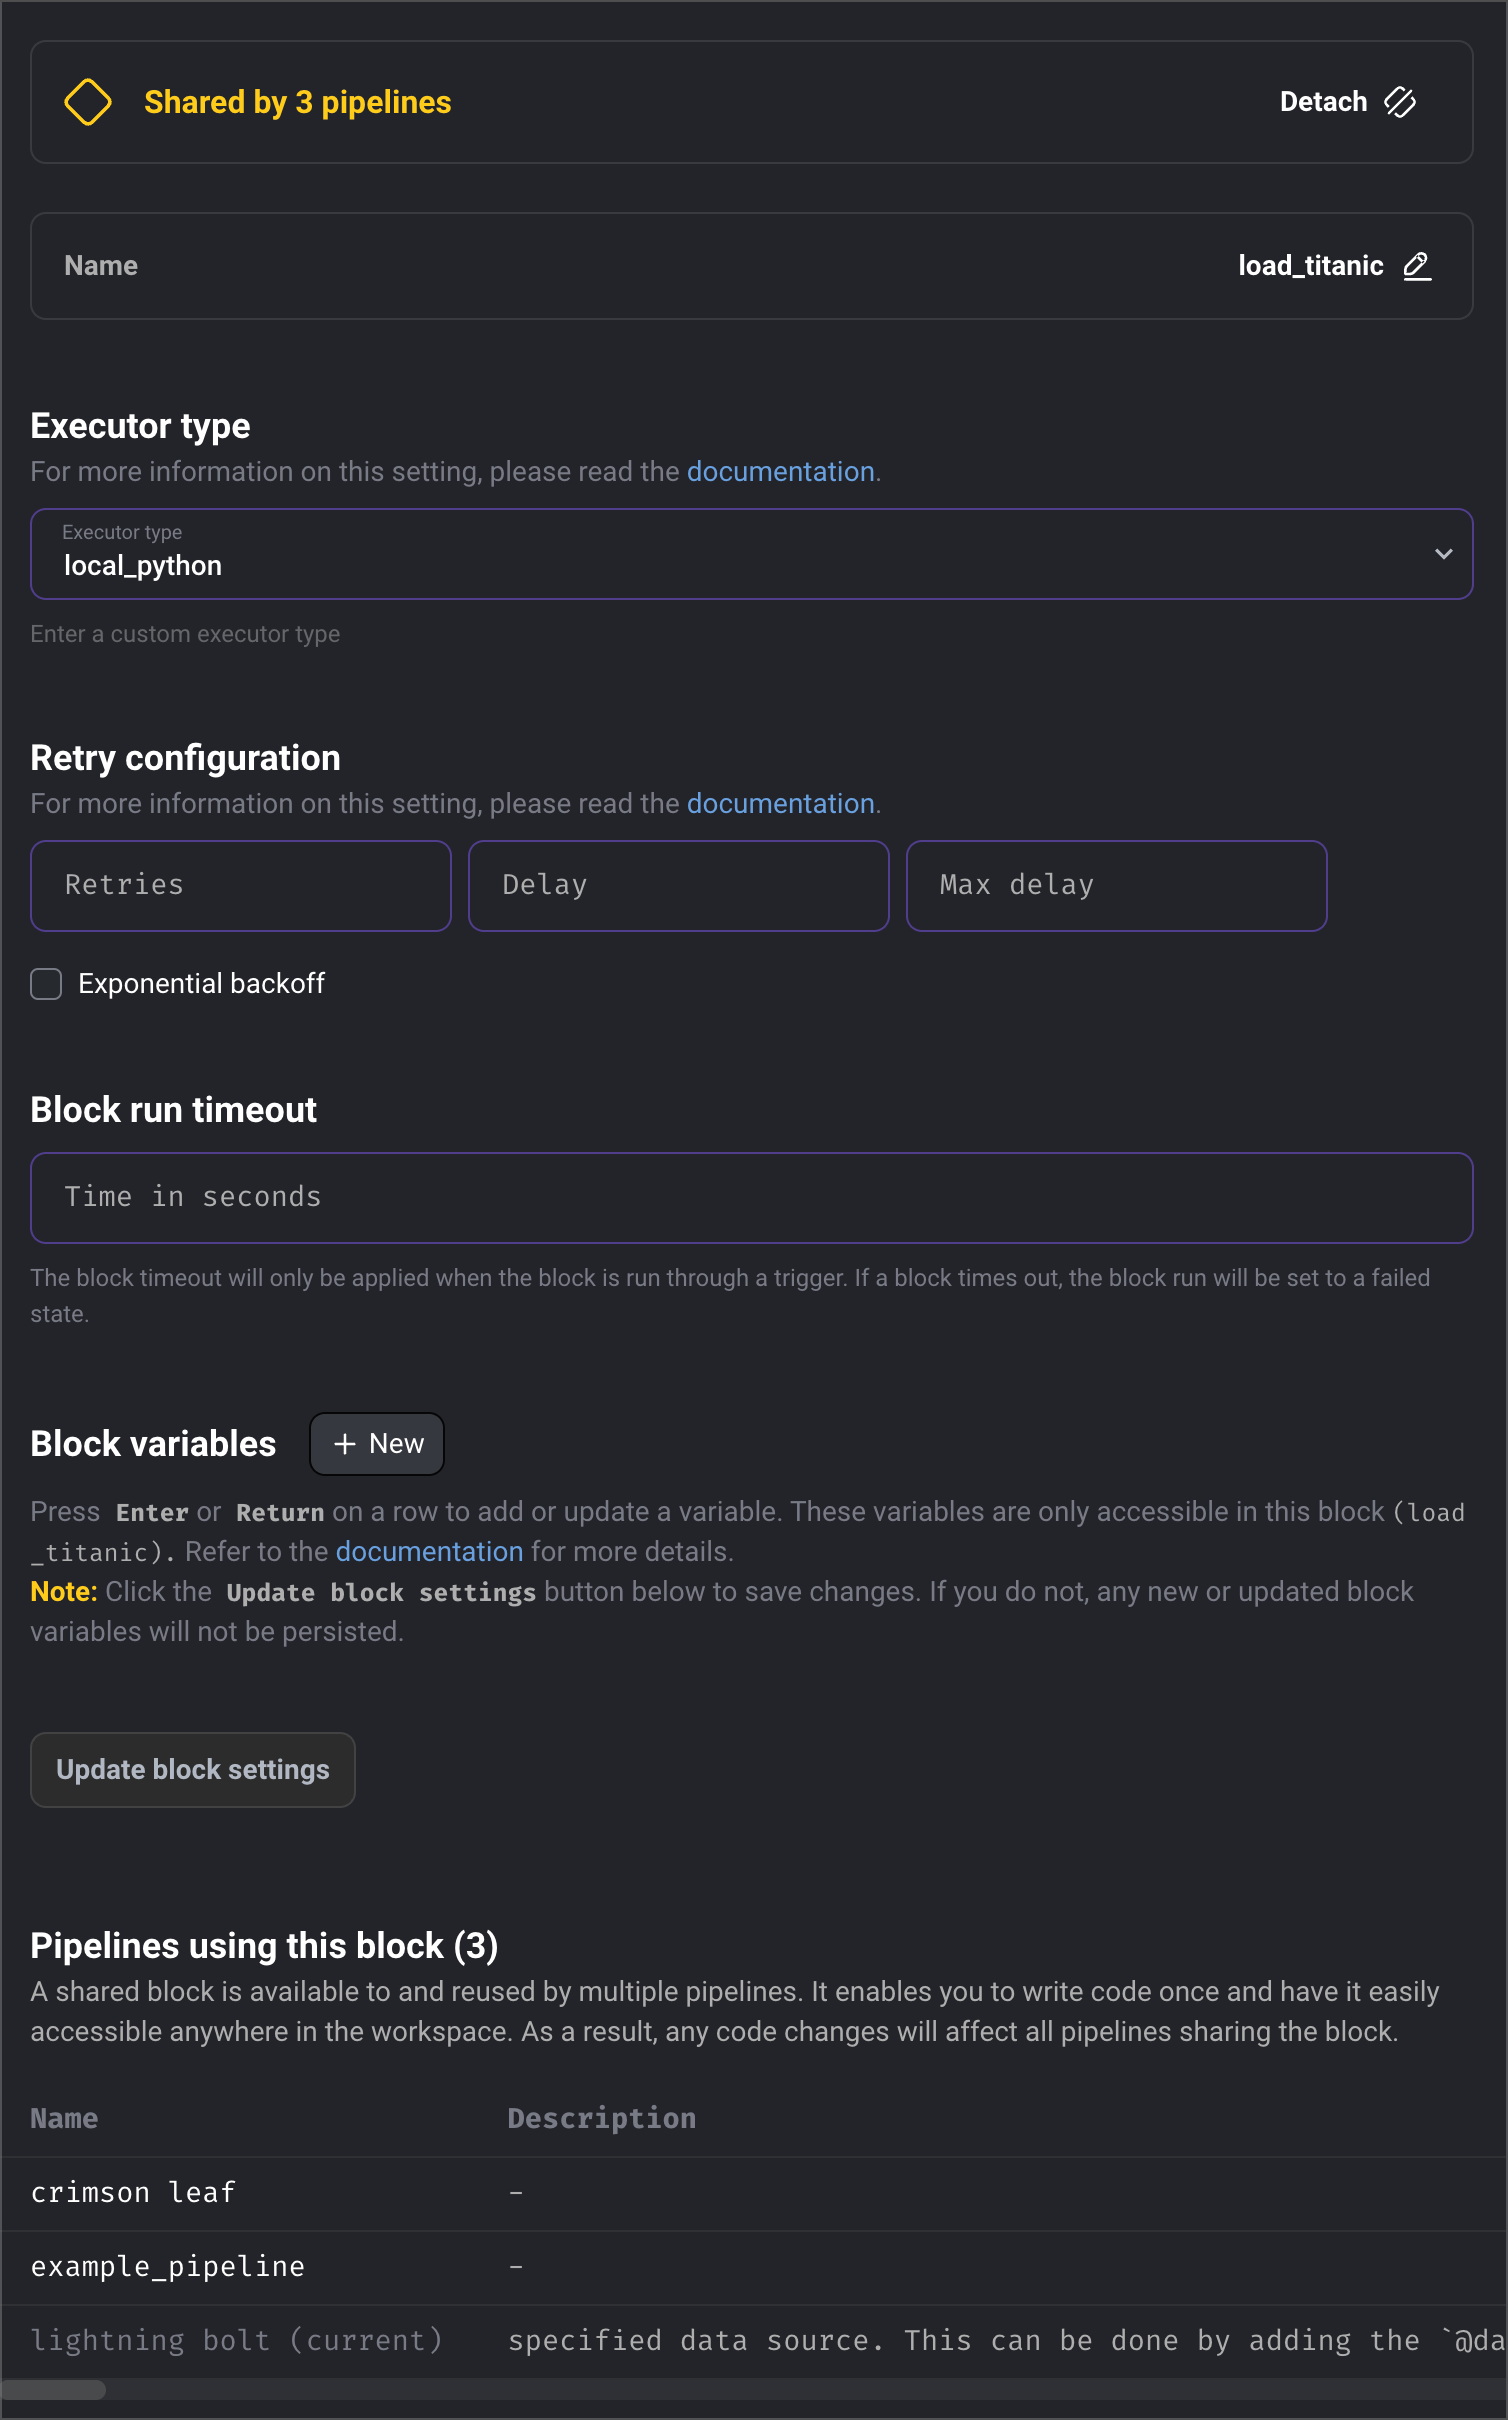
Customize settings for every individual block
- Rename a block
- Set what execution engine the block should use
- Configure how the block should retry itself in case of failure
- Set a timeout limit for how long the block can run before it should fail
- Configure variables specific to a block
- View which pipelines are currently using a block