

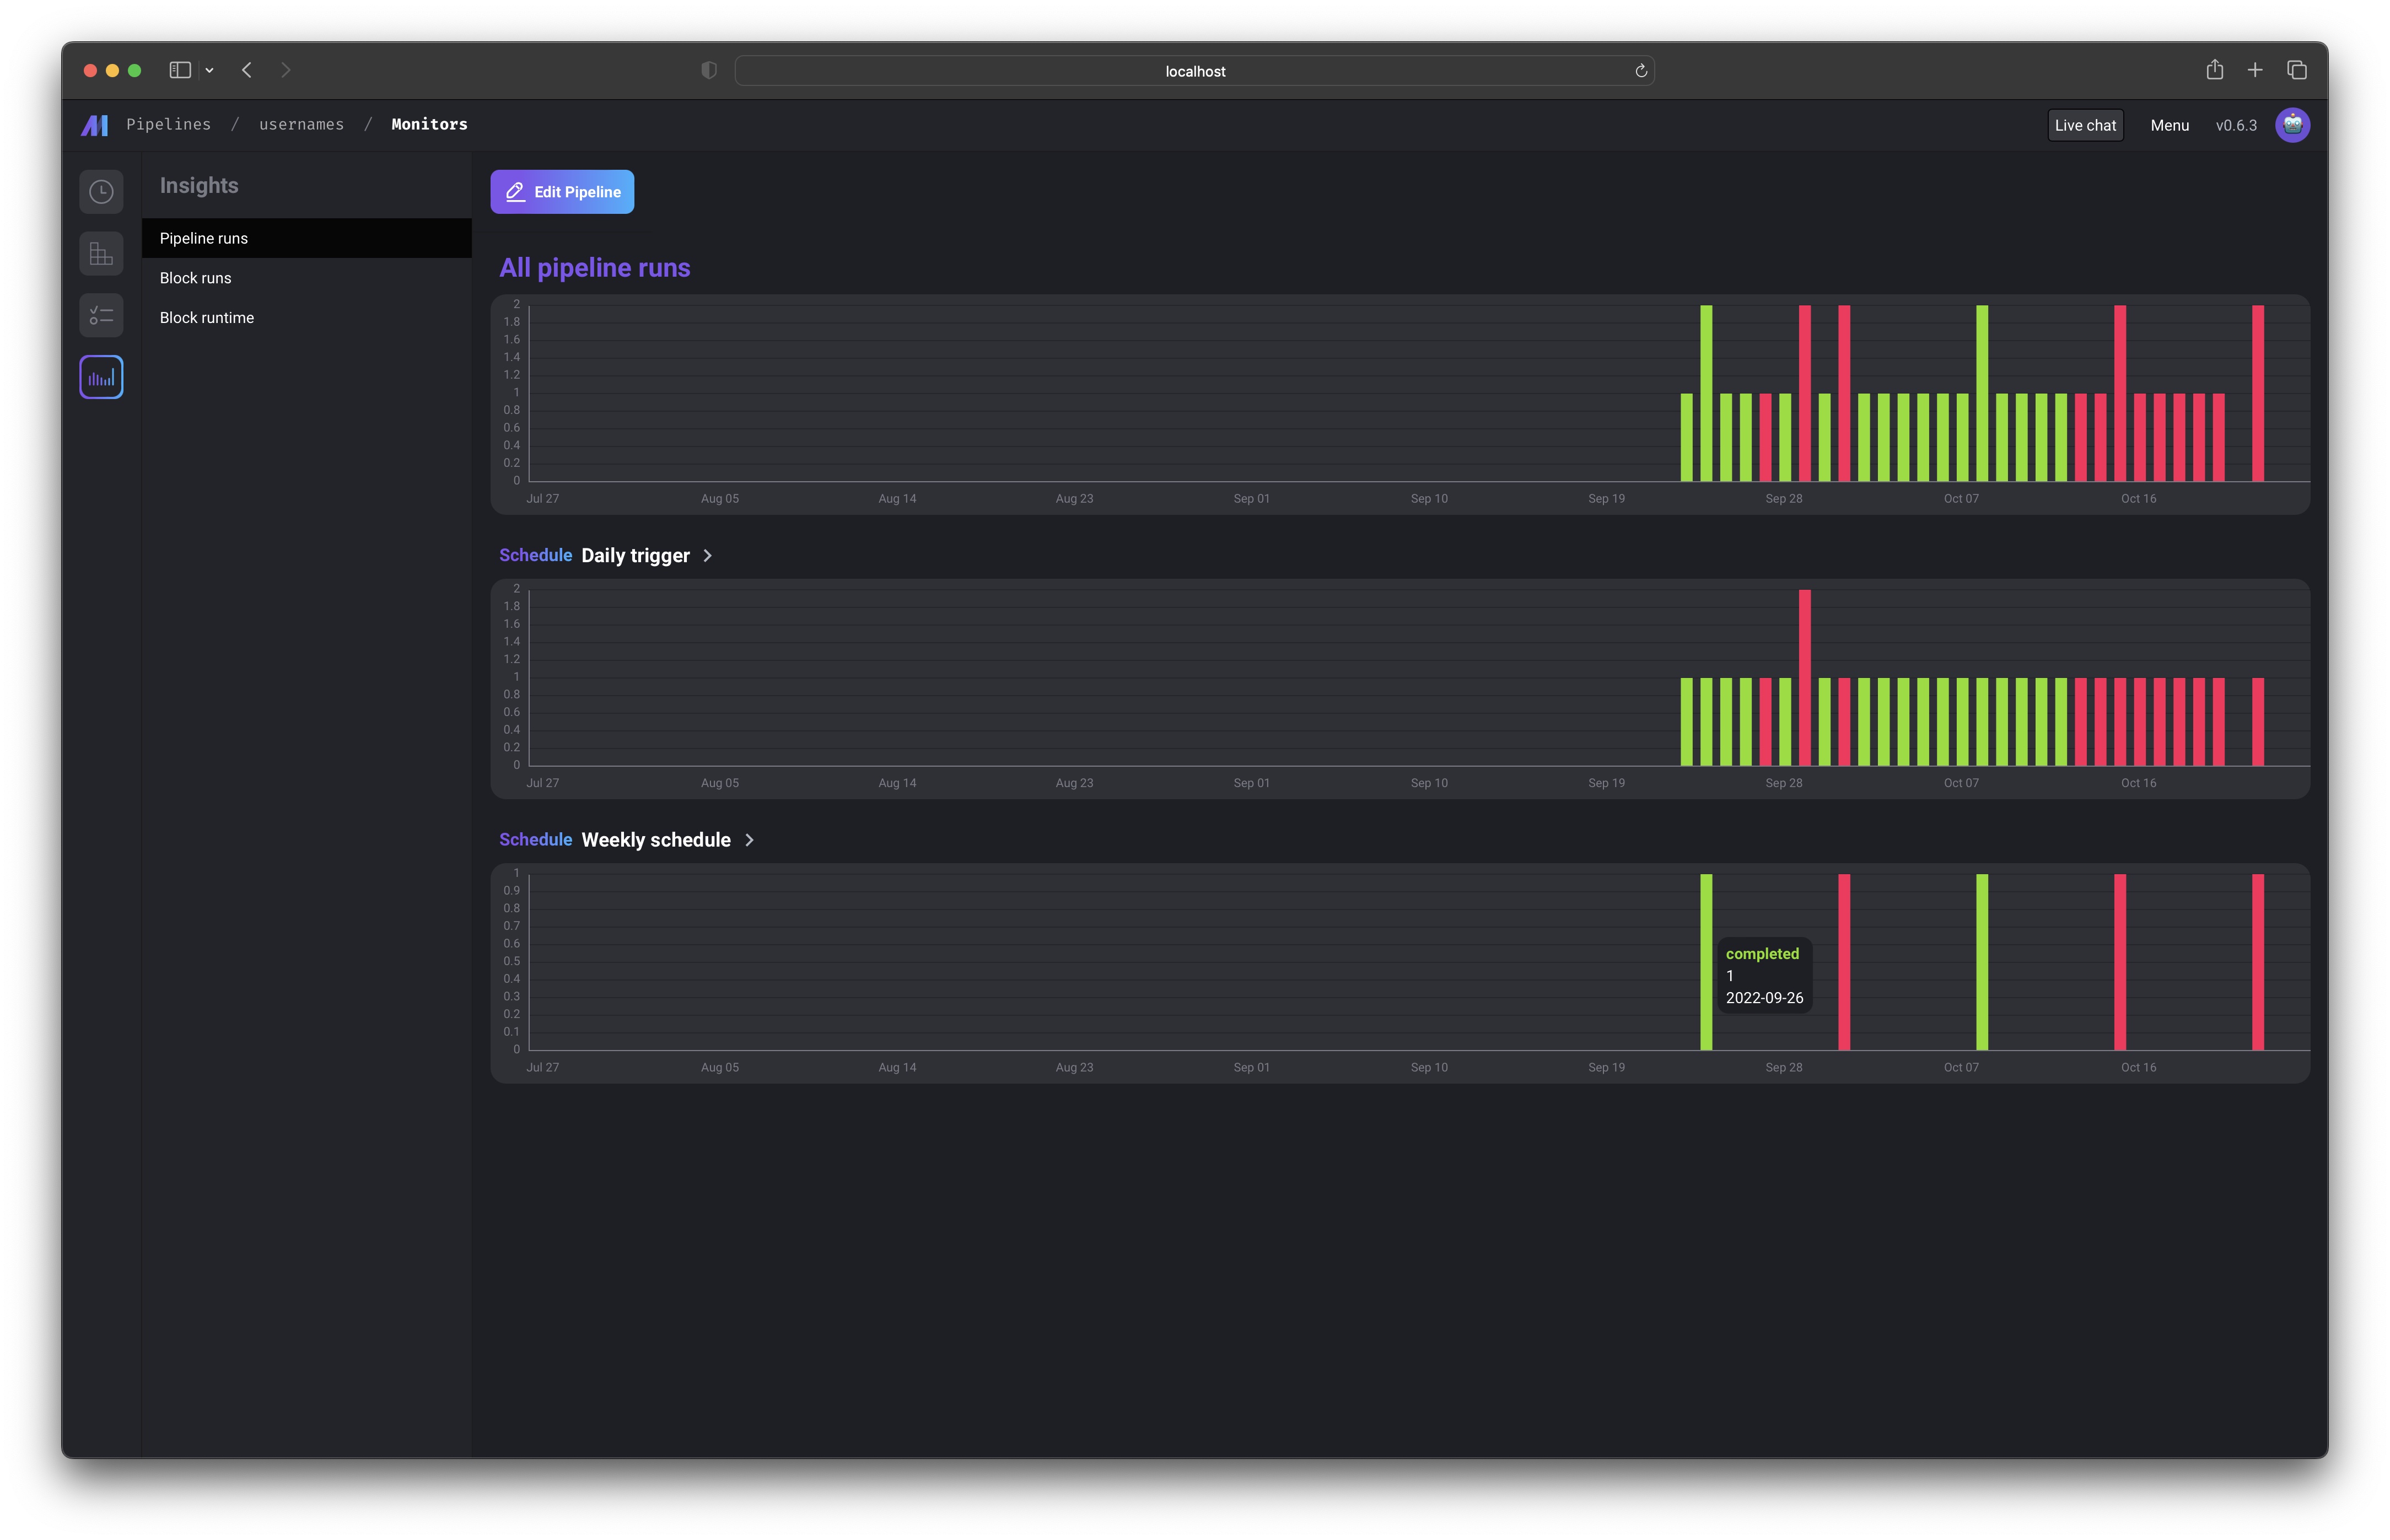
Metrics
Here are the following metrics that are monitored for each pipeline and block:- Pipeline runs completed successfully
- Pipeline runs failed
- Block runs completed successfully
- Block runs failed
- How long each block ran for
- CPU usage for Kubernetes block and pipeline runs in Mage Pro
- Memory usage for Kubernetes block and pipeline runs in Mage Pro
- Data validation success for each block (coming soon)
- Data validation failure for each block (coming soon)
Overview monitoring actions
The Overview page includes actions for the monitoring panels:- Fix runs opens AI Sidekick with a prompt to investigate failing runs for the selected time range.
- Analyze runs opens AI Sidekick with a prompt to inspect active runs for the selected time range.
- View triggers opens the trigger list, preserving the selected compute cluster filter when one is active.