

io_config.yaml profiles, saved data
integration source and destination configs, and compatible pipeline execution
outputs into one workspace for browsing schemas, previewing data, running
guarded SQL, and handing useful context to AI Sidekick.
Use Data Explorer when you want to answer questions before building or changing
a pipeline:
- Which tables, streams, schemas, and columns are available in this warehouse?
- Does this source stream contain the records I expect?
- What does the latest order, event, customer, metric, or operational table look like?
- Can I validate a destination table after a sync without writing a throwaway block?
- What did this upstream pipeline block actually produce?
- Which pipeline run or block run produced the data shape I am debugging?
- What query should become the first version of a loader, chart, dashboard, or investigation?
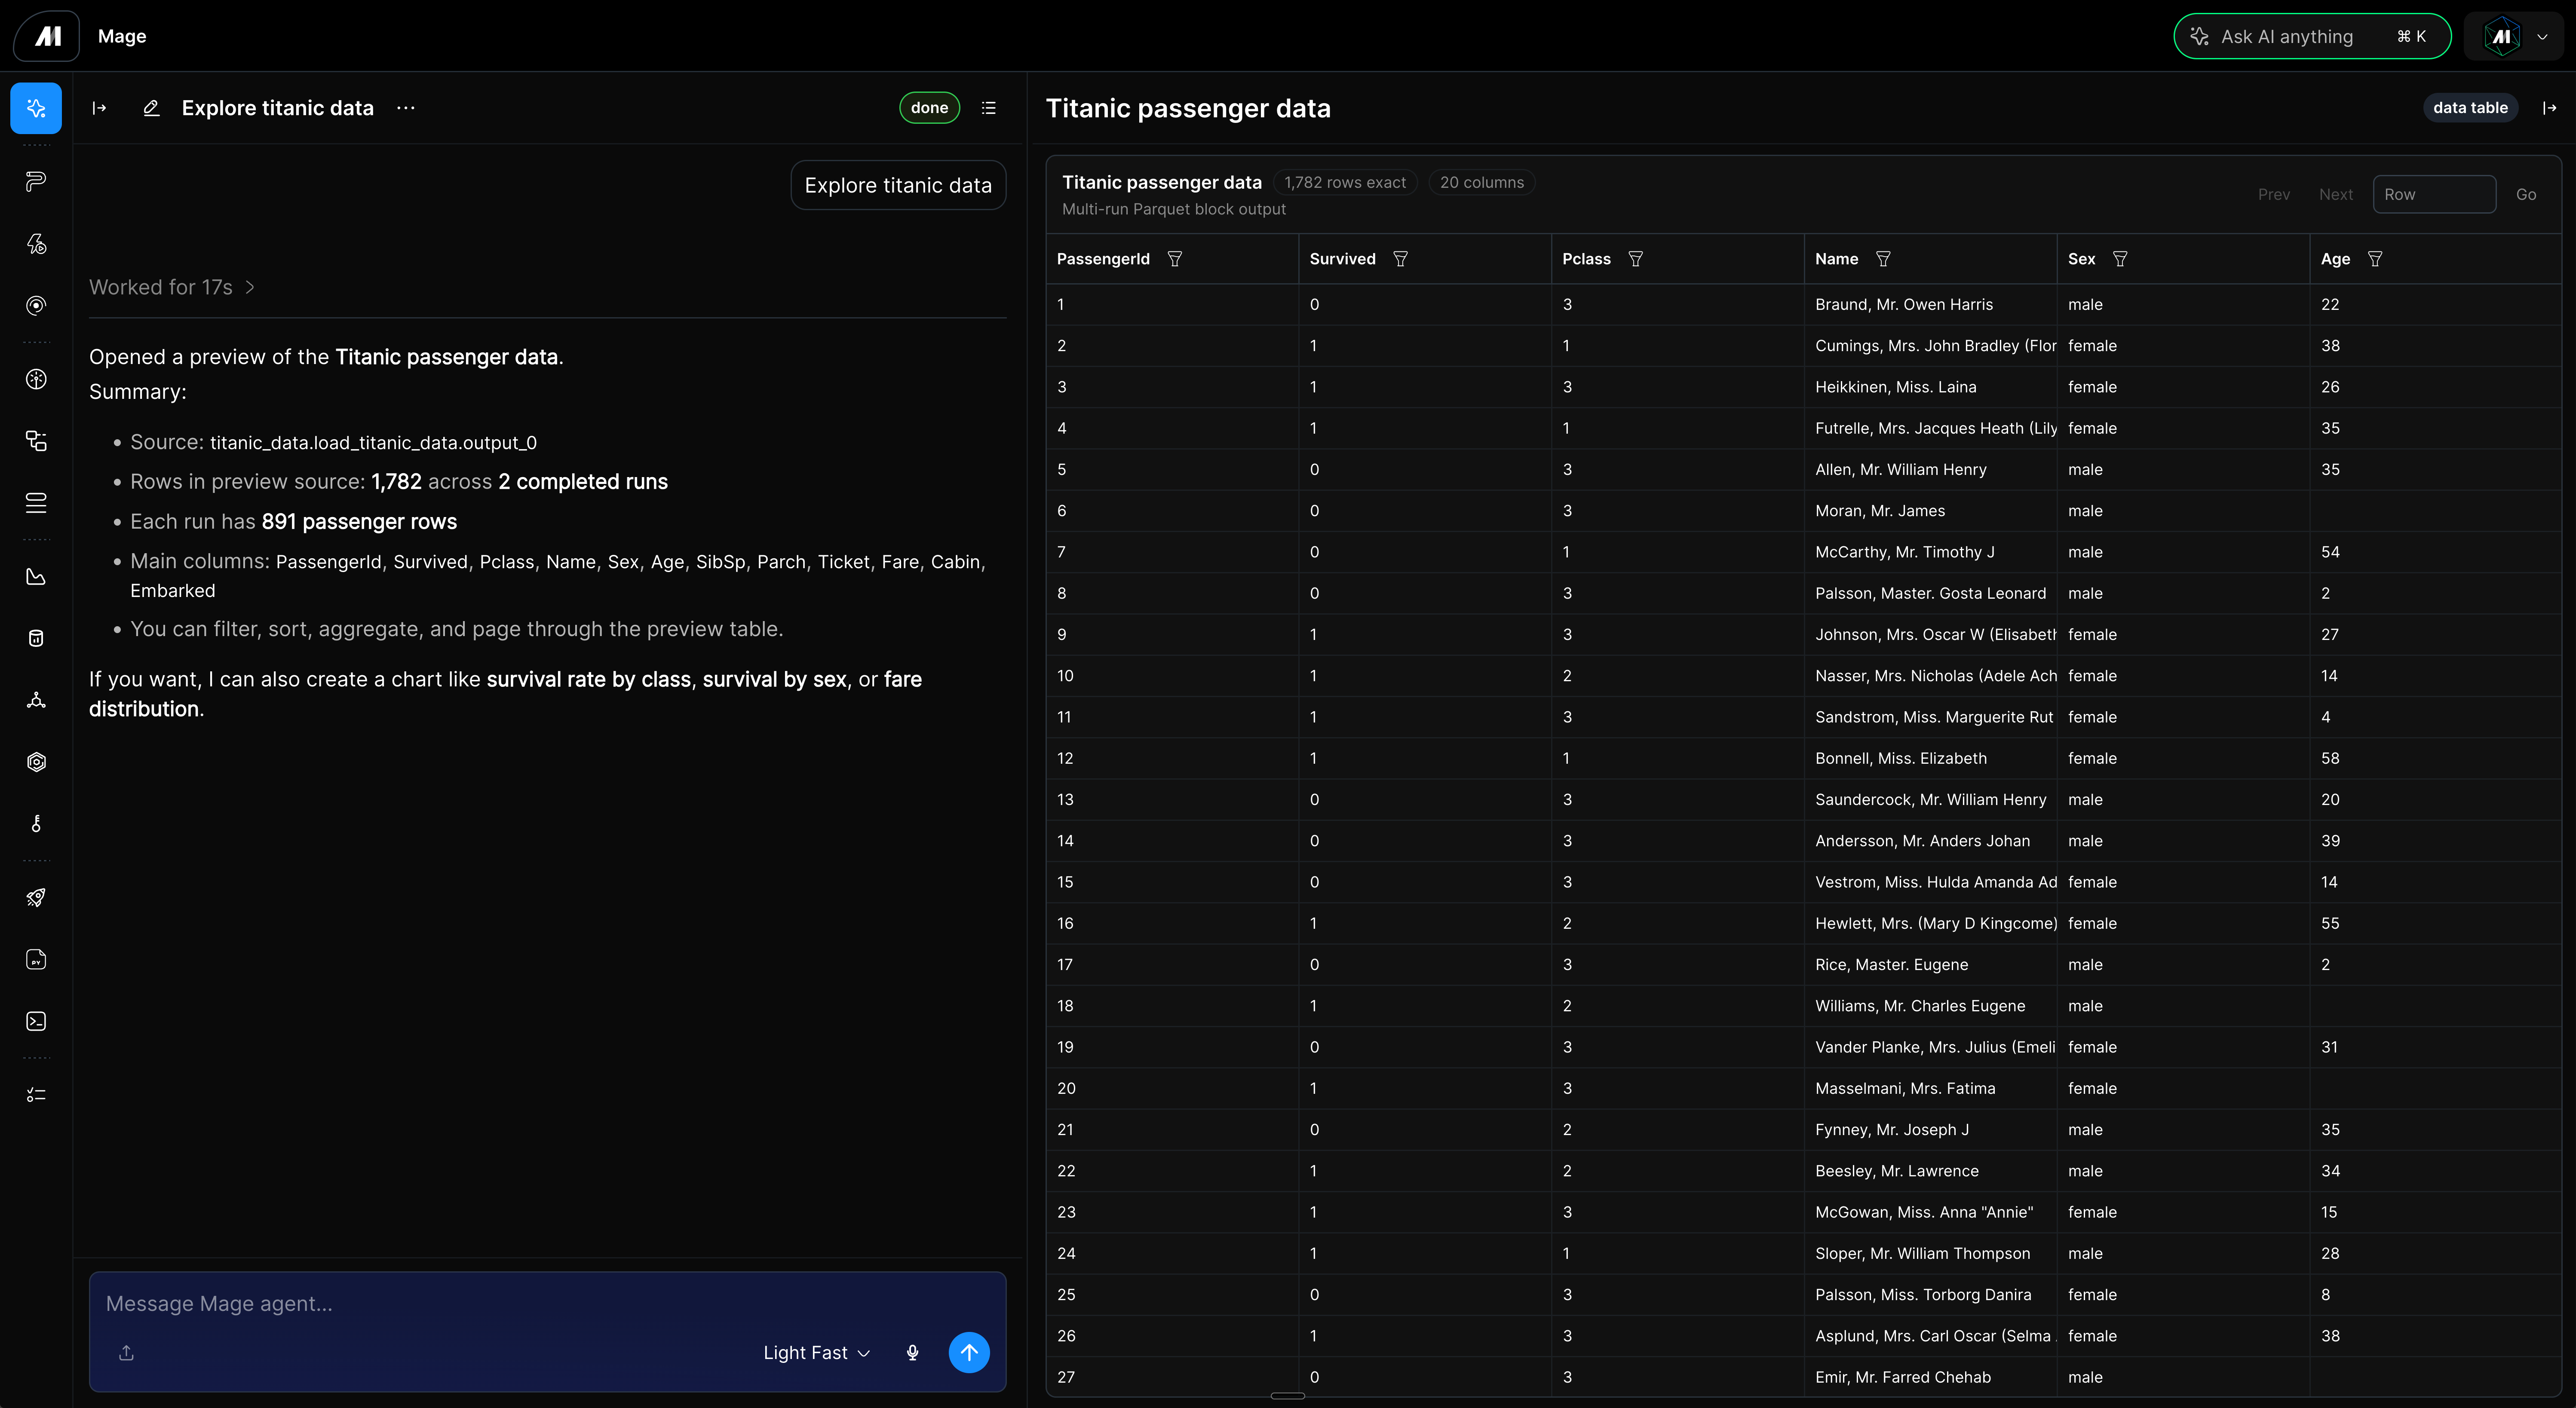
Explore data with AI
If AI Sidekick is enabled, Data Explorer shows Explore data with AI above the explorer. Clicking it starts a new Sidekick thread from the Data Explorer page. Use this when you want Sidekick to help with questions such as:- “Find the best connection for recent customer activity.”
- “Help me write a query for failed payments in the last week.”
- “Inspect available tables before I build a loader.”
- “Compare the destination table columns with the source stream shape.”
- “Help me decide whether the issue is in the source table or a pipeline block output.”
- “Find the block run output that explains why this pipeline run produced fewer rows.”
Open Data Explorer
In Mage Pro, open Data Explorer from either location:- Select Data Explorer from the sidebar.
- Open Apps, then select Data Explorer.
What you can do
Data Explorer combines connection inventory, schema metadata, previews, SQL, and AI-assisted investigation in one page.Supported connections
Data Explorer lists existing connections from:io_config.yamlSQL provider profiles.- Saved data integration source configs.
- Saved data integration destination configs.
- Compatible pipeline execution outputs, including block outputs associated with pipeline runs and block runs.
io_config.yaml SQL providers include:
- BigQuery
- ClickHouse
- Databricks
- Druid
- DuckDB
- Microsoft Fabric
- MySQL
- OracleDB
- PostgreSQL
- Redshift
- Snowflake
- Spark
- SQLite
- Microsoft SQL Server
- Trino
delta_lake_s3 config when the config points to a readable
Delta table with either a full s3:// table URI or a bucket, object key path,
and table name.
Pipeline execution outputs are available for compatible executable blocks and
run outputs. Data Explorer uses Mage’s preview system to load a bounded output
window so you can inspect intermediate results from a pipeline run or block run
without adding temporary print statements, export blocks, or one-off validation
code.
Permissions
Viewers can open Data Explorer and review the connection inventory. Editor access is required to browse schemas, preview a table, or run SQL. Saved source and destination configs follow the permissions of the pipeline that owns the config:- Users only see integration configs from pipelines they can view.
- Users must be able to edit the owning pipeline before running a preview or SQL query through that config.
- Pipeline and block run outputs follow the permissions of the pipeline that produced the output.
Browse schemas and columns
For supportedio_config.yaml SQL profiles, Data Explorer can browse metadata
without loading a full warehouse inventory in the initial connection list. It
loads each level as you select it:
- Catalogs or databases
- Schemas
- Tables
- Columns
SELECT * FROM <selected_table>.
Selecting a table also loads its columns and types.
The schema browser includes a search box that filters visible catalogs, schemas,
tables, and columns. It also includes a refresh control for the selected
connection so you can reload metadata after upstream tables or schemas change.
During dependent metadata loads, Data Explorer keeps stable panels visible where
possible so the page does not blank out while the next level loads.
Schema browsing is currently supported for these IO config providers:
- DuckDB
- Microsoft Fabric
- MySQL
- PostgreSQL
- Redshift
- Snowflake
- SQLite
- Microsoft SQL Server
Preview a table, stream, or run output
- Select a connection from All, IO configs, Sources, or Destinations.
- For
io_config.yamlconnections with metadata support, use the schema browser to confirm or change the selected catalog or database, schema, and table. - For saved source or destination configs, choose a table or stream when options are available.
- For compatible pipeline or block run outputs, choose the output you want to inspect.
- If the connection does not provide table options, or the schema browser does not load a matching table, type the table or stream name.
- Set a row limit.
- Click Preview table.
SELECT * FROM <table_or_stream> query.
Pipeline and block run output previews load a bounded output window through
Mage’s data preview system. The default row limit is 100, and Mage clamps row
limits to protect the workspace from accidentally large previews.
Delta Lake S3 previews read the table through Mage’s Delta Lake connector and
return only the requested preview window. They are useful when you want to
validate a Delta destination table before using it in Sidekick exploration,
Analytics chart creation, or dashboard refresh.
Preview is useful for quick checks:
Run a SQL query
- Select a SQL-capable connection.
- Enter one
SELECTorWITHquery. - Set a row limit.
- Click Run query.
SELECT or WITH statement at a time. Mutating
statements such as INSERT, UPDATE, DELETE, and DROP are rejected.
Locking clauses such as FOR UPDATE or FOR SHARE are rejected. Multi-statement
SQL is rejected. Data Explorer also rejects SELECT or WITH queries that call
known unsafe functions with side effects, such as functions that update
sequences, terminate sessions, sleep, read server-local files, or execute
provider-specific system commands.
These safeguards are not the same as database-enforced read-only execution for
every provider. PostgreSQL and Redshift preview and query execution start a
database read-only transaction before running the query and roll it back
afterward. Metadata browsing uses server-generated SELECT queries with
provider timeout settings. Metadata discovery, preview, and query execution are
also bounded by server-side deadlines. For providers with native timeout
controls, Data Explorer passes those settings to the driver or query job. If a
provider call exceeds the relevant deadline, Data Explorer attempts
provider-native cancellation where available, closes or stops the bounded
execution operation, and returns a timeout error. Other supported providers rely
on statement validation, restricted-function checks, provider timeout or
lock-timeout settings where available, bounded server execution deadlines, and
row-limit enforcement.
For those providers, use credentials that already have the least privileges
needed for exploration.
Review results
After a preview or query succeeds, Data Explorer shows the returned rows in a table. Use the column headers to sort the returned rows, or open a column filter to narrow the rows shown in the current result. These sort and filter controls apply only to the returned sample. To filter the full source table, add the filter to the SQL query. Returned row counts describe the loaded preview window, not the total number of rows in the source table. To answer full-table cardinality questions, run an exactCOUNT(*) query against
the selected table or filtered query.
When a tabular result is available, click Expand results to hide the
connection, schema, and query browser and give the results table more space.
Click Back to restore the explorer panels. Data Explorer remembers this
layout preference for future result tables.
If a preview returns warnings from the data preview service, Data Explorer shows
those warnings with the result so the loaded rows are not separated from
important context.
Practical workflows
Validate a new connection
- Add or update an
io_config.yamlprofile. - Open Data Explorer.
- Search for the provider or profile name.
- Confirm the connection is available.
- Browse schemas and tables, or type a known table name.
- Preview a small row window.
- Run a targeted
SELECTquery to confirm credentials and schema access.
Inspect a data integration source
- Open Data Explorer.
- Select Sources.
- Choose the saved source config from the connection list.
- Select a stream when the source catalog provides stream options.
- Preview the stream to confirm field names and representative records.
- Use the table output to decide what should become a transformation or downstream validation.
Check a destination after a sync
- Open Data Explorer.
- Select Destinations.
- Choose the destination config owned by the integration pipeline.
- Select or type the destination table.
- Preview rows or run a narrow SQL query that checks the records affected by the latest sync.
Inspect a pipeline run or block run output
- Open Data Explorer.
- Search for the pipeline, block, or run identifier.
- Choose the compatible pipeline output, block output, pipeline run output, or block run output from the available results.
- Preview a bounded output window.
- Compare the output shape and sample rows with the source, destination, or next block in the pipeline.
- Use the result to decide whether the issue came from the upstream data, transformation code, runtime variables, or a downstream destination.
Turn discovery into implementation
- Use the schema browser to find the right table and columns.
- Run a guarded SQL query with filters, ordering, and selected columns.
- Copy the query into a data loader, chart workflow, or dashboard workflow.
- Keep Data Explorer open as a quick verification tool while you iterate.
Safety model
Data Explorer is built for exploration, not uncontrolled execution.- It accepts only one
SELECTorWITHstatement per query request. - It rejects mutating statements, locking clauses, multi-statement SQL, and known unsafe functions.
- It clamps preview and query limits on the server.
- It bounds metadata requests separately from preview and query requests.
- It loads compatible pipeline and block run outputs as bounded preview windows.
- It applies provider timeout settings where available.
- It attempts provider-native cancellation when supported.
- It redacts sensitive config values and error details before returning them.
- PostgreSQL and Redshift query execution use read-only transactions that roll back after the query.
Troubleshooting
No connections appear
Confirm that the project has a supportedio_config.yaml SQL profile, saved
data integration source or destination config, or compatible outputs from
pipelines, pipeline runs, or block runs the user can view.
A connection appears as unavailable
Open the connection and read the unavailable reason. Common causes include placeholder values, incompleteio_config.yaml provider settings, missing
credentials, a saved source or destination provider that cannot be mapped to a
SQL-capable IO provider, a pipeline run whose output is no longer available, or
a block type whose output cannot be previewed.
Preview or query buttons are disabled
Confirm that the selected connection supports the action, a table or query is entered, metadata is not still loading, and the user has Editor access. Viewers can inspect the inventory, but they cannot browse schemas, preview data, or run SQL.Schema browser does not appear
The schema browser appears for supportedio_config.yaml connections with
metadata support. For other SQL-capable connections, type the table name or SQL
query manually.
Results are sorted or filtered differently than the source table
Result table sort and filter controls operate on the returned preview window only. AddWHERE, ORDER BY, grouping, or joins to the SQL query when the
filter must run against the full source table.