Only in Mage Pro.Try our fully managed solution to access this advanced feature.
Pages with customizable dashboards
- Project overview page (
/overview?tab=Dashboard) - Pipeline dashboard page (
/pipelines/[:id]/dashboard)
Adding charts
- In the top right corner of the dashboard, click the button labeled + Add content.
- Click the dropdown option labeled Create new chart.
Configuring chart
Chart name
Human readable name for your chart.Chart type
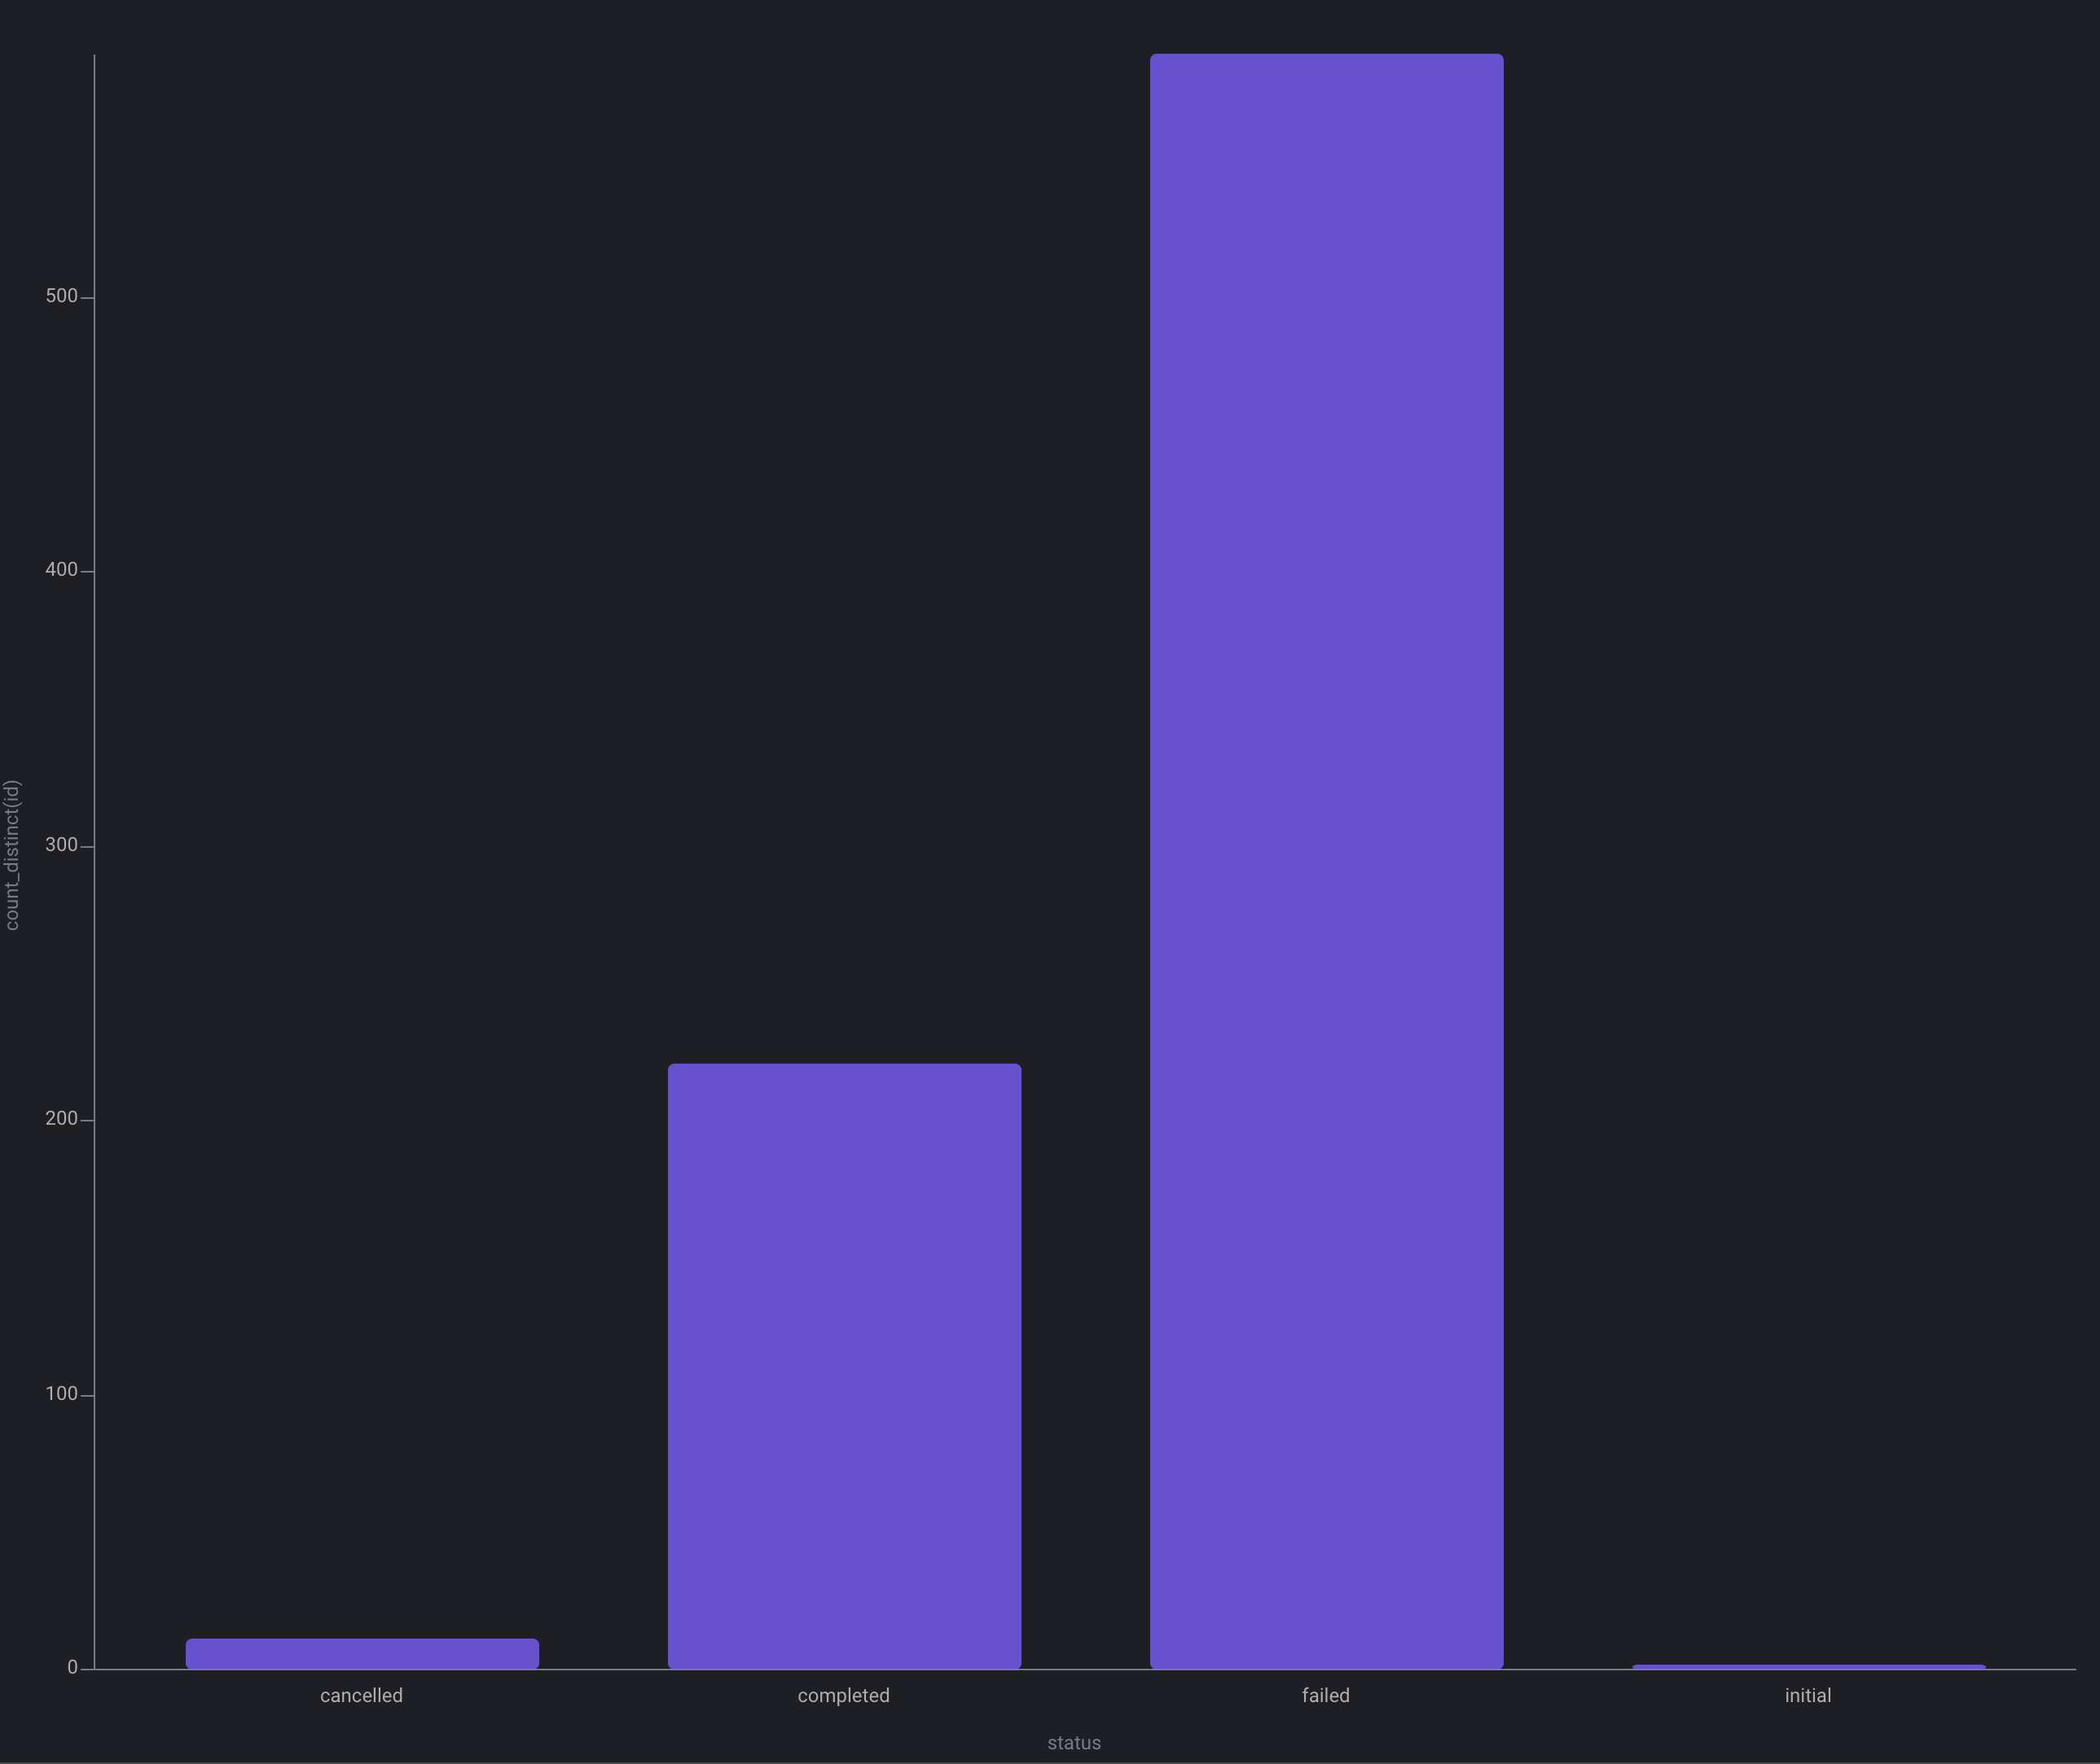
Choose from a variety of visualizations.Bar chart
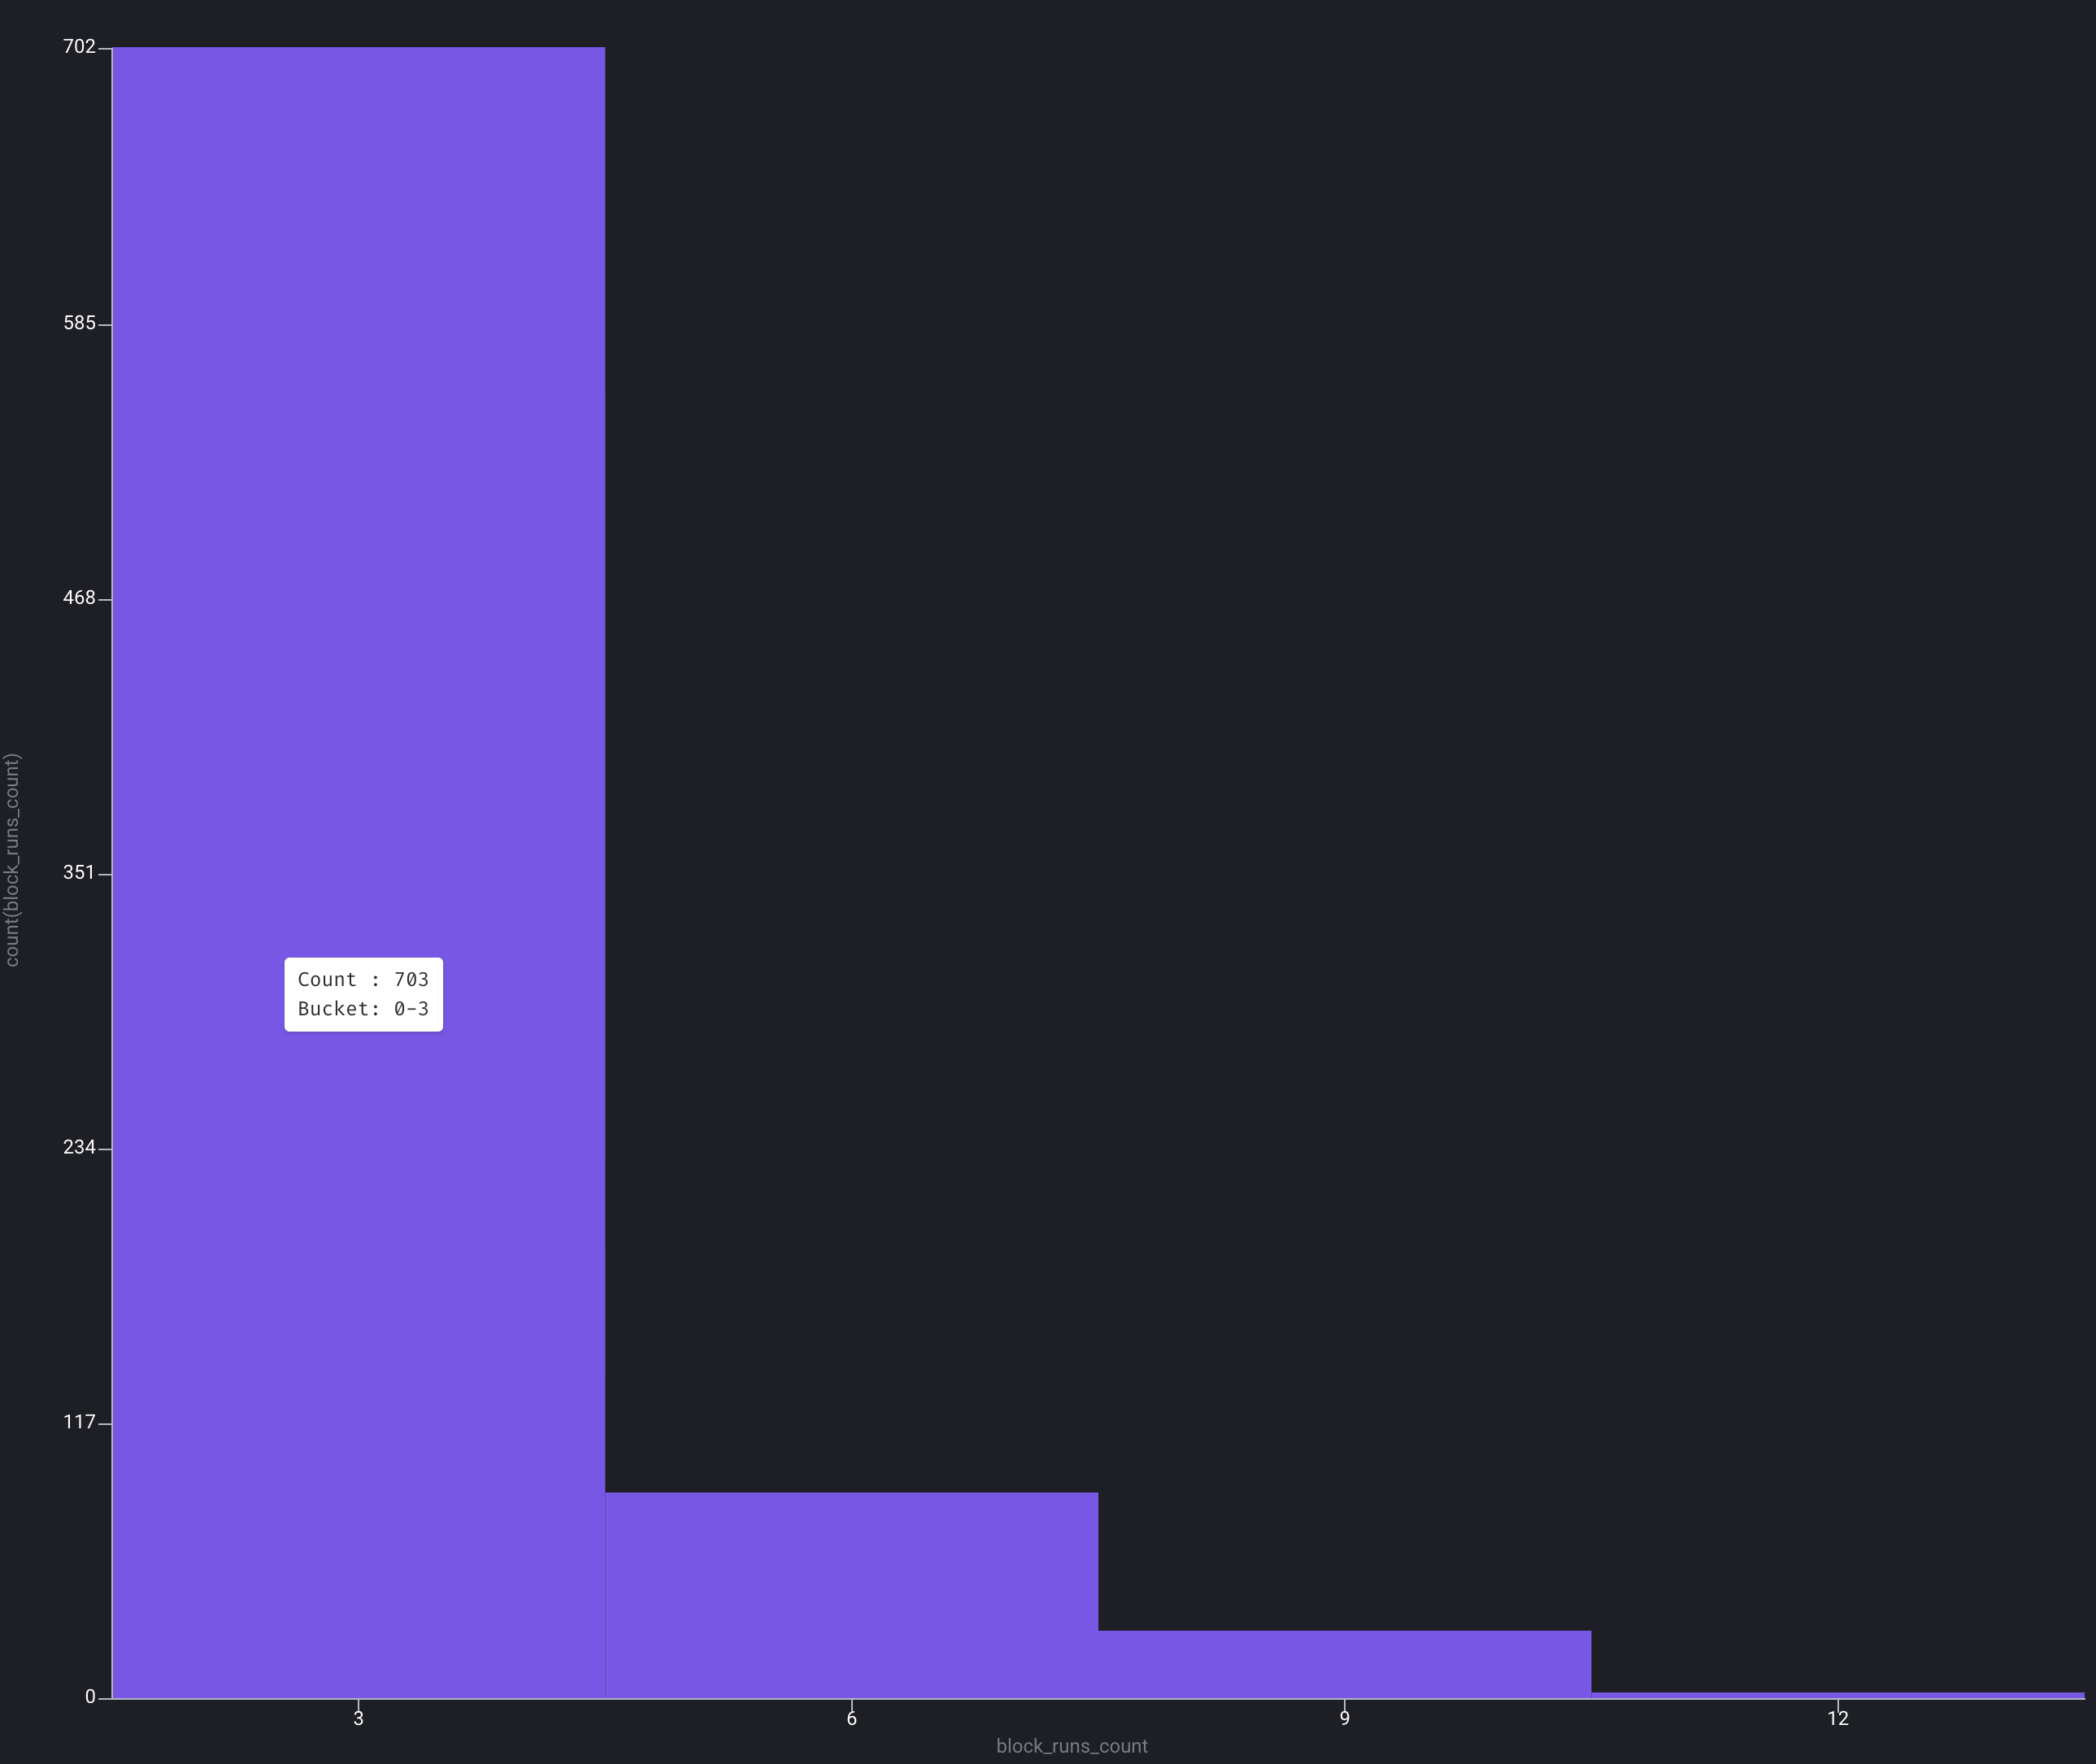
Histogram
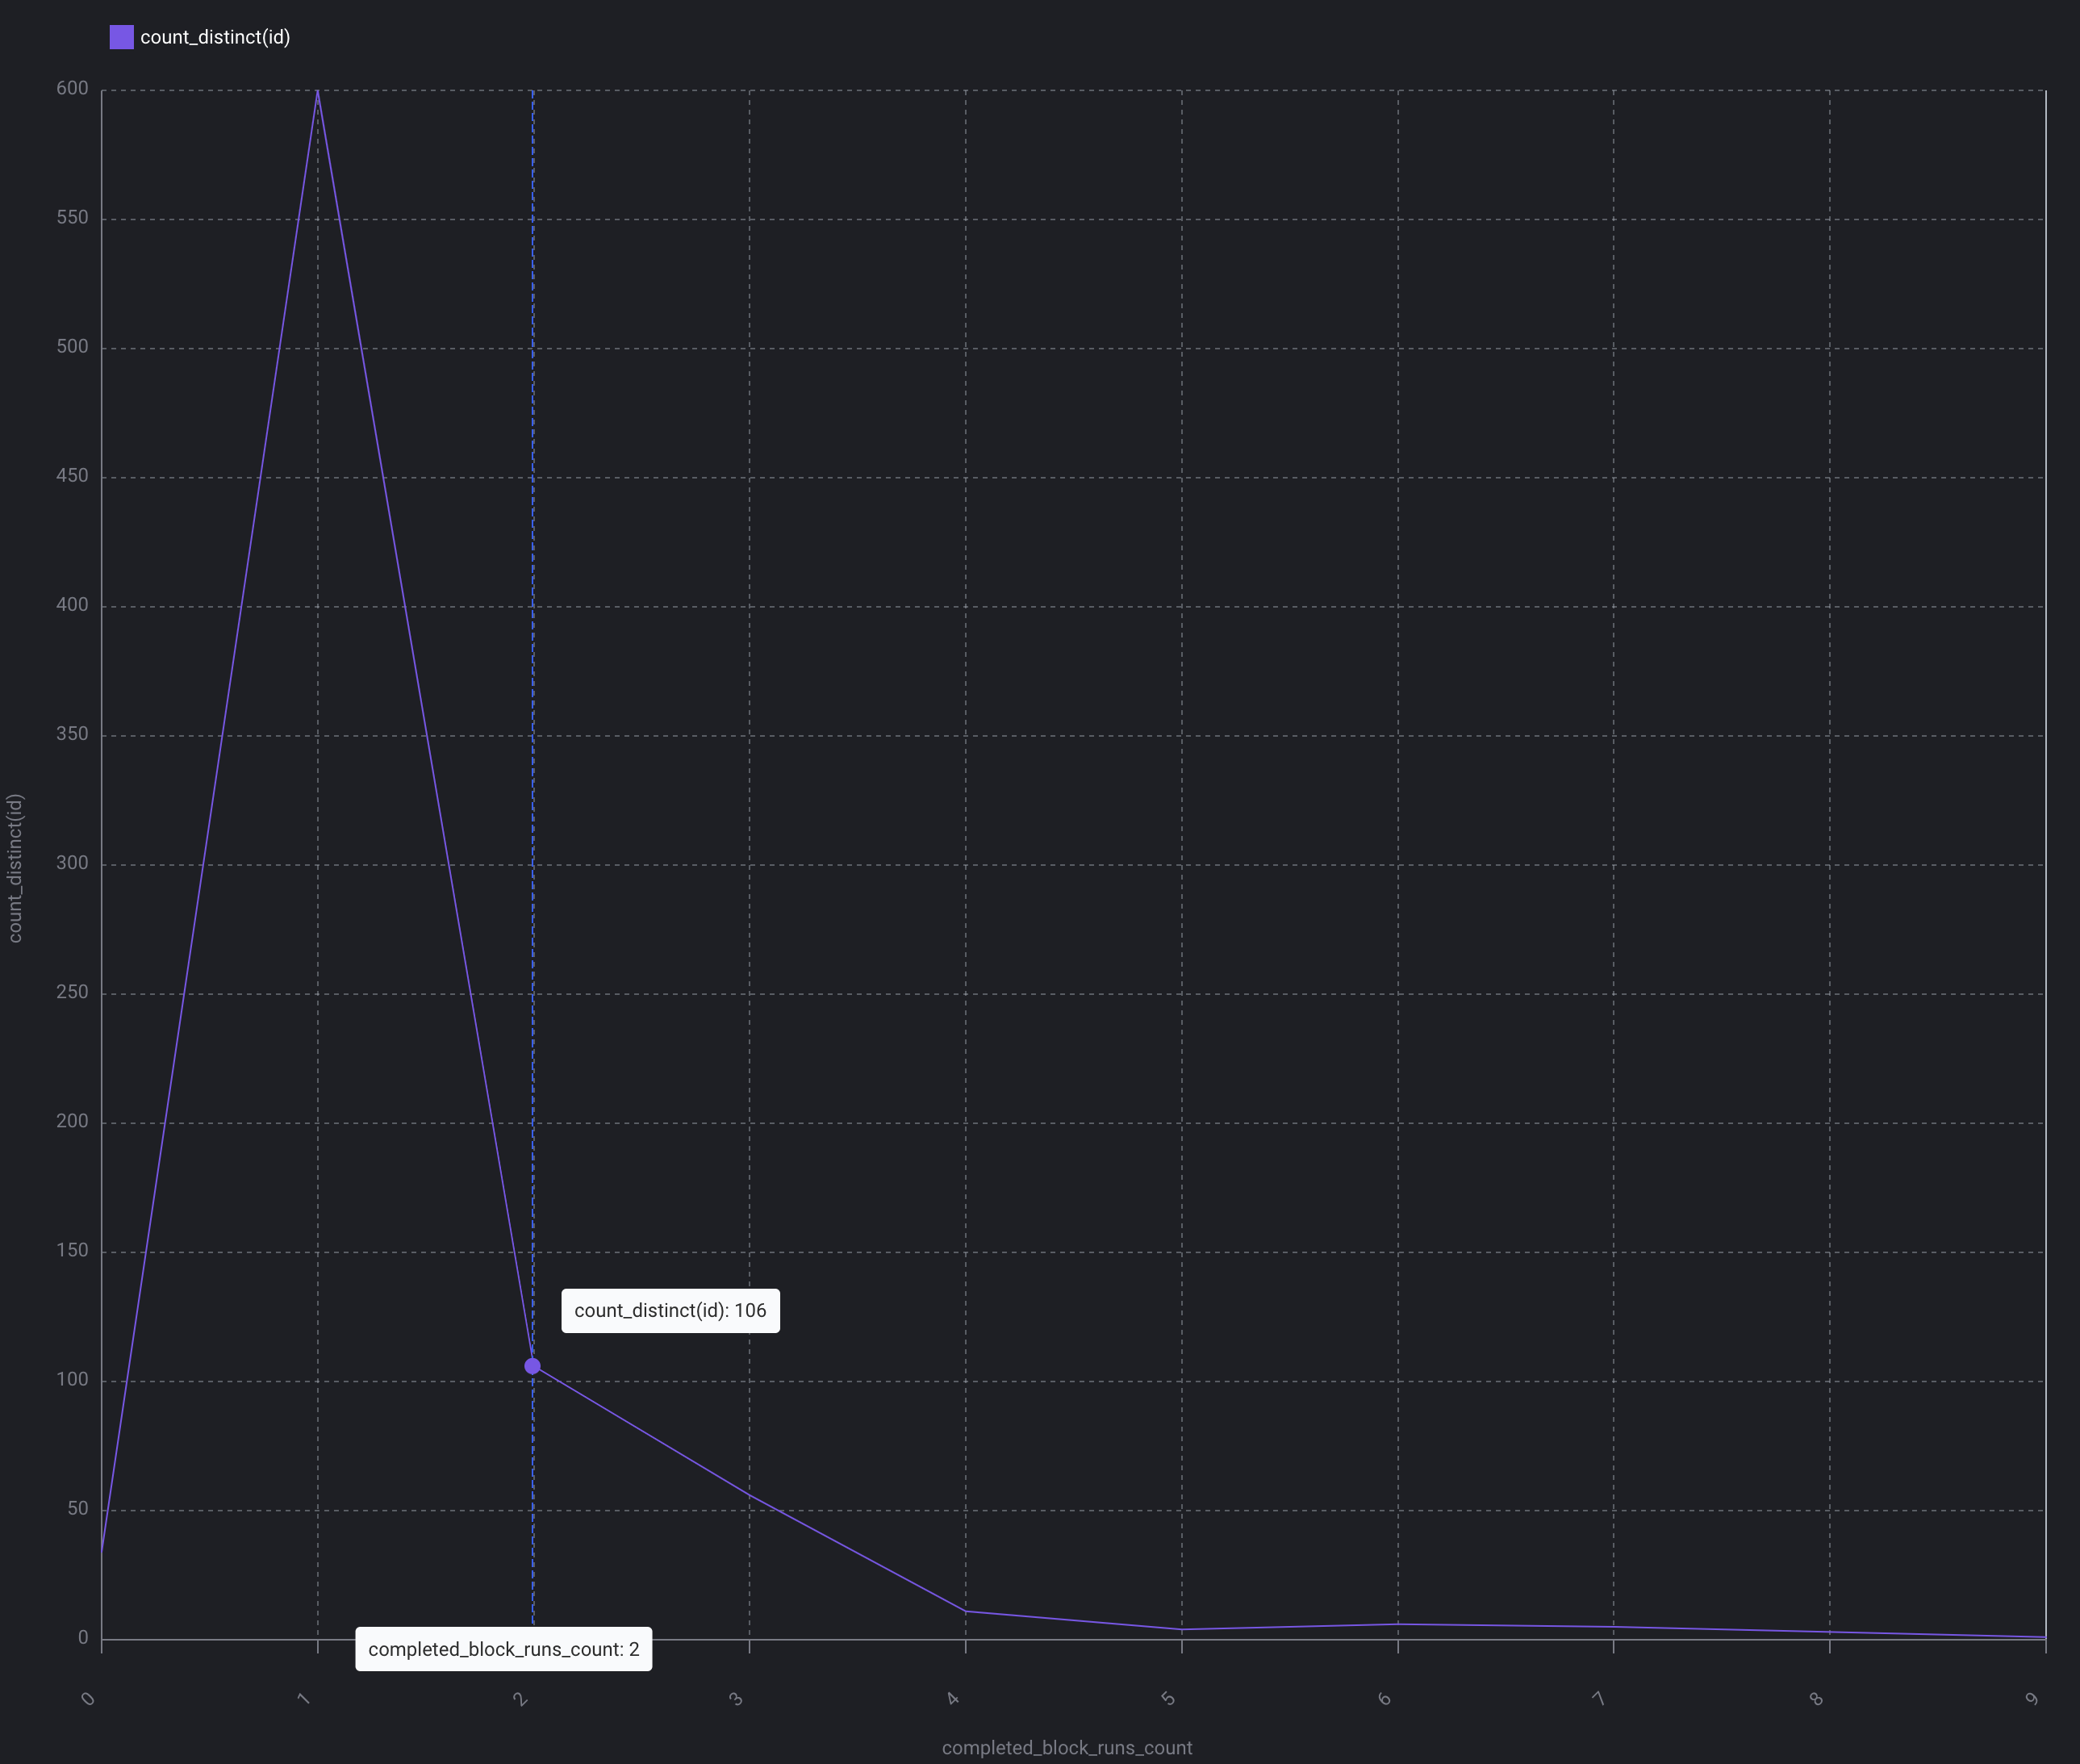
Line chart
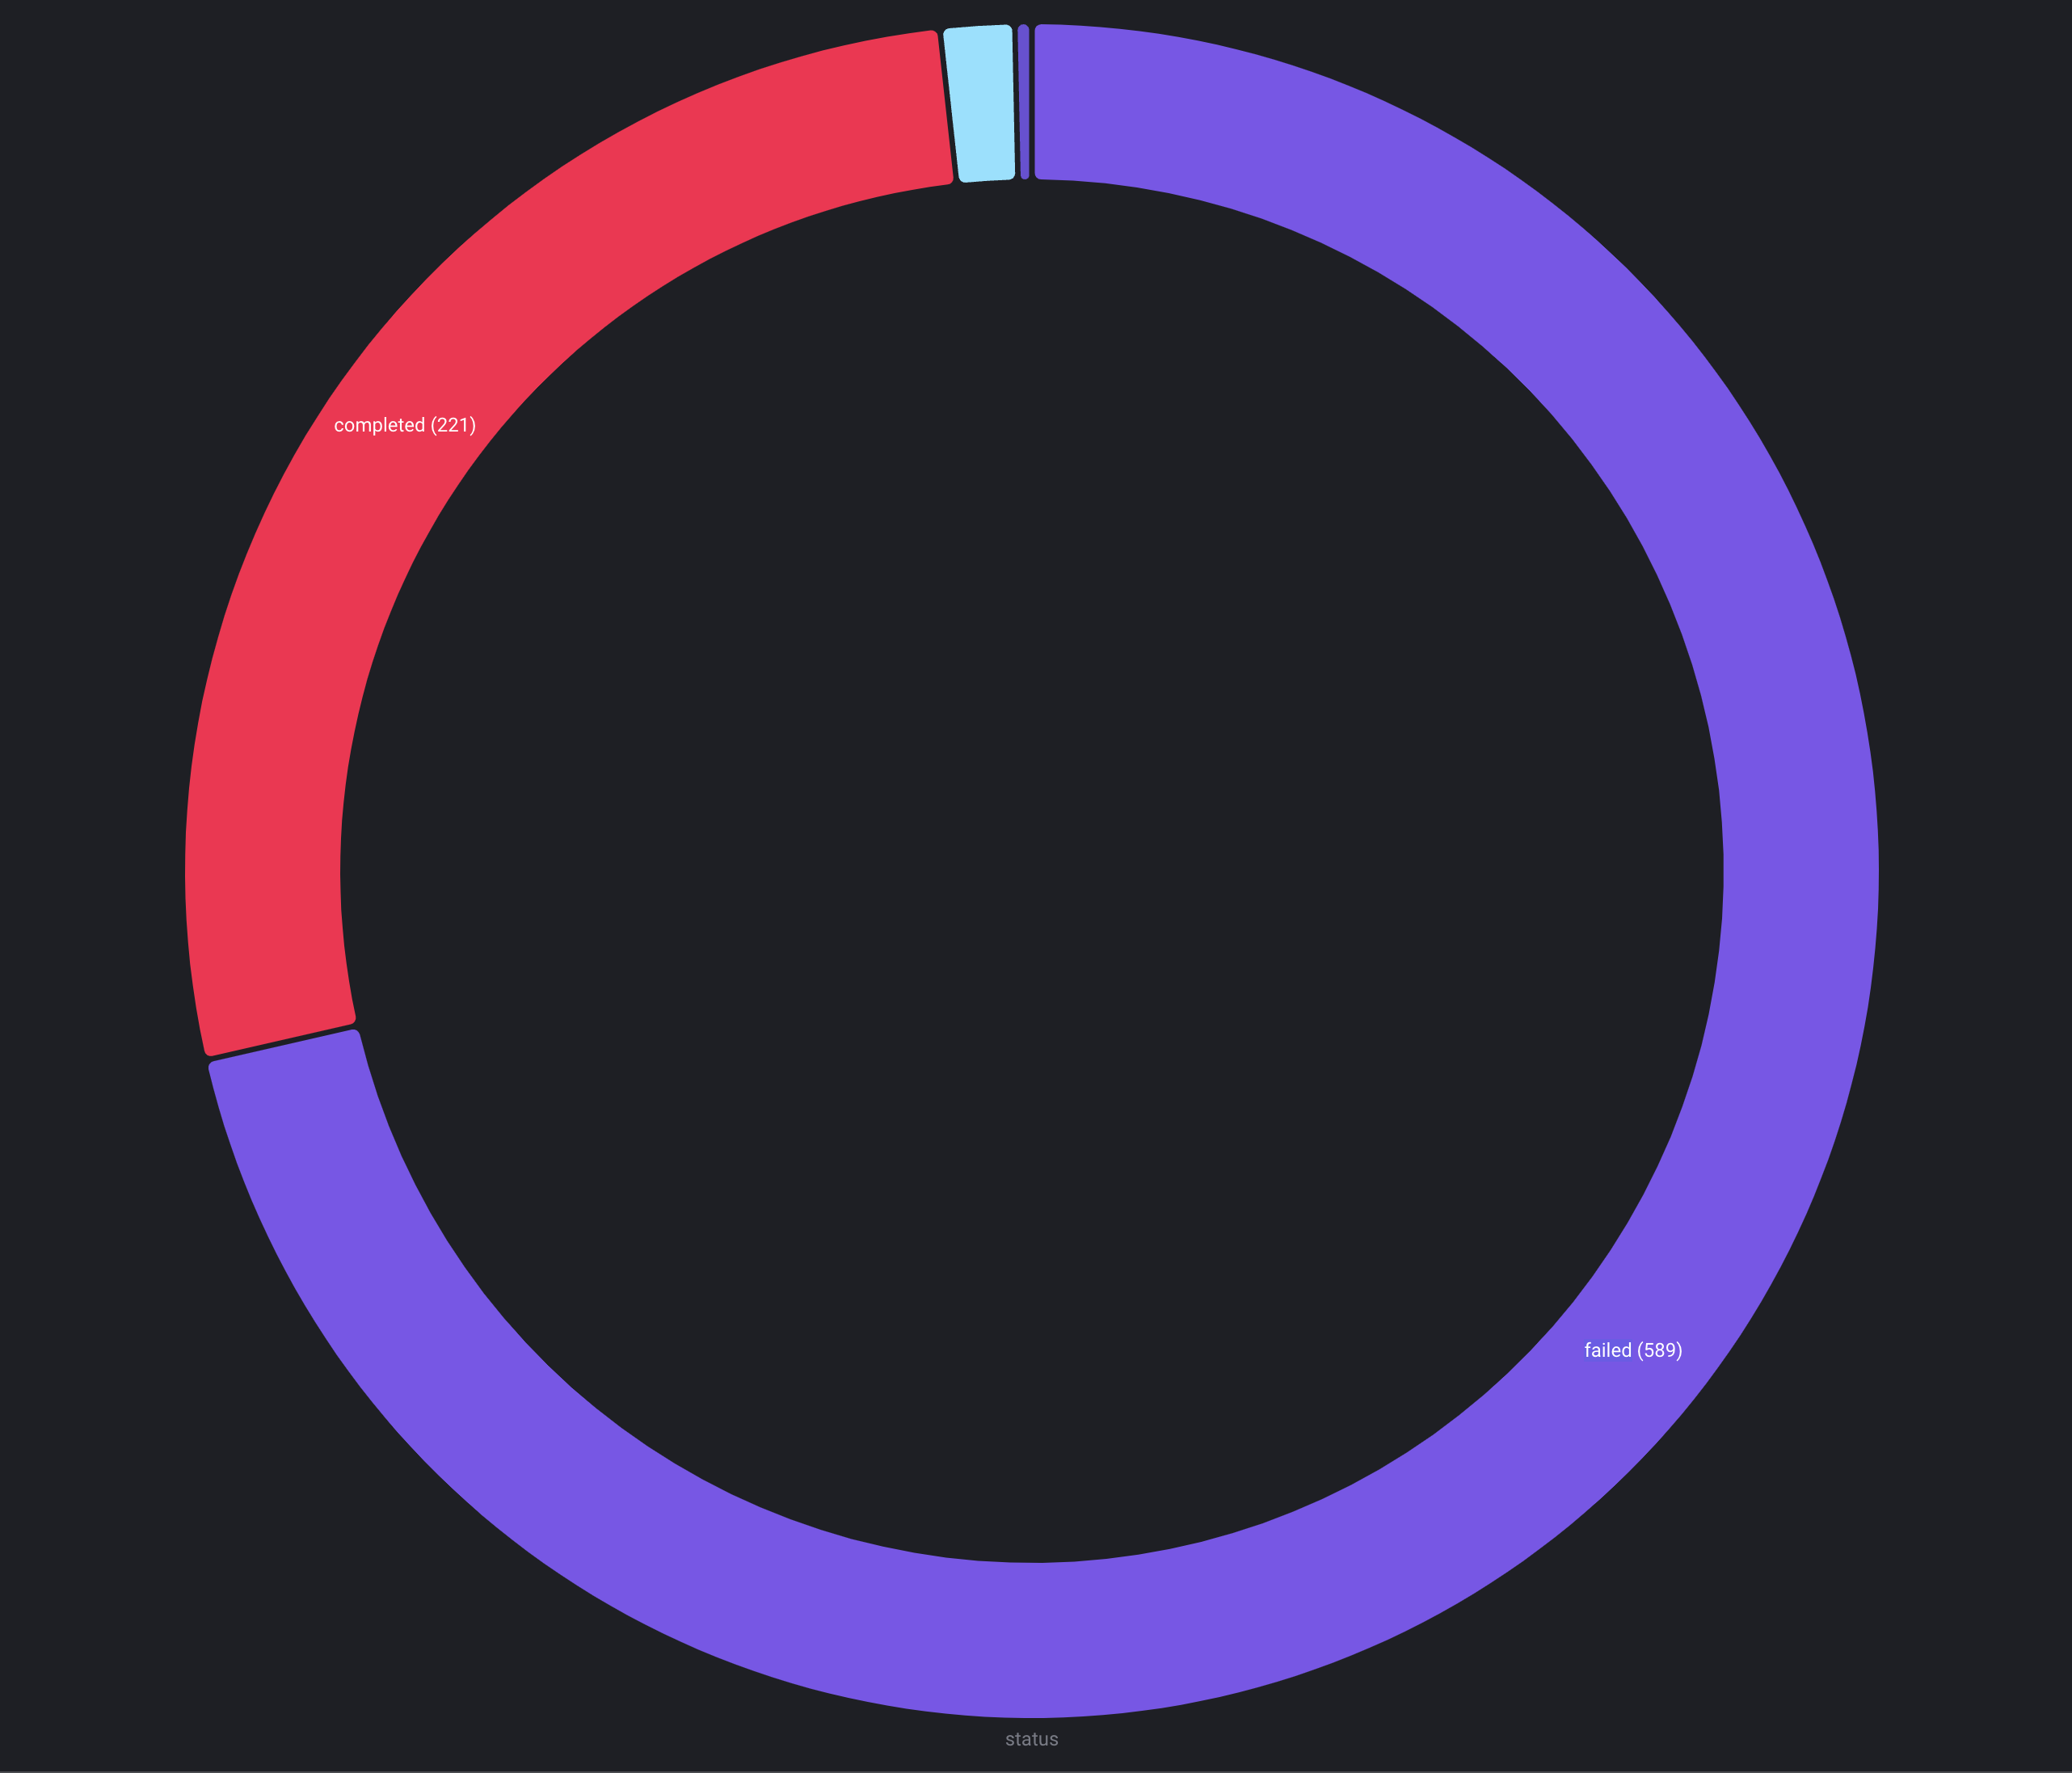
Pie chart
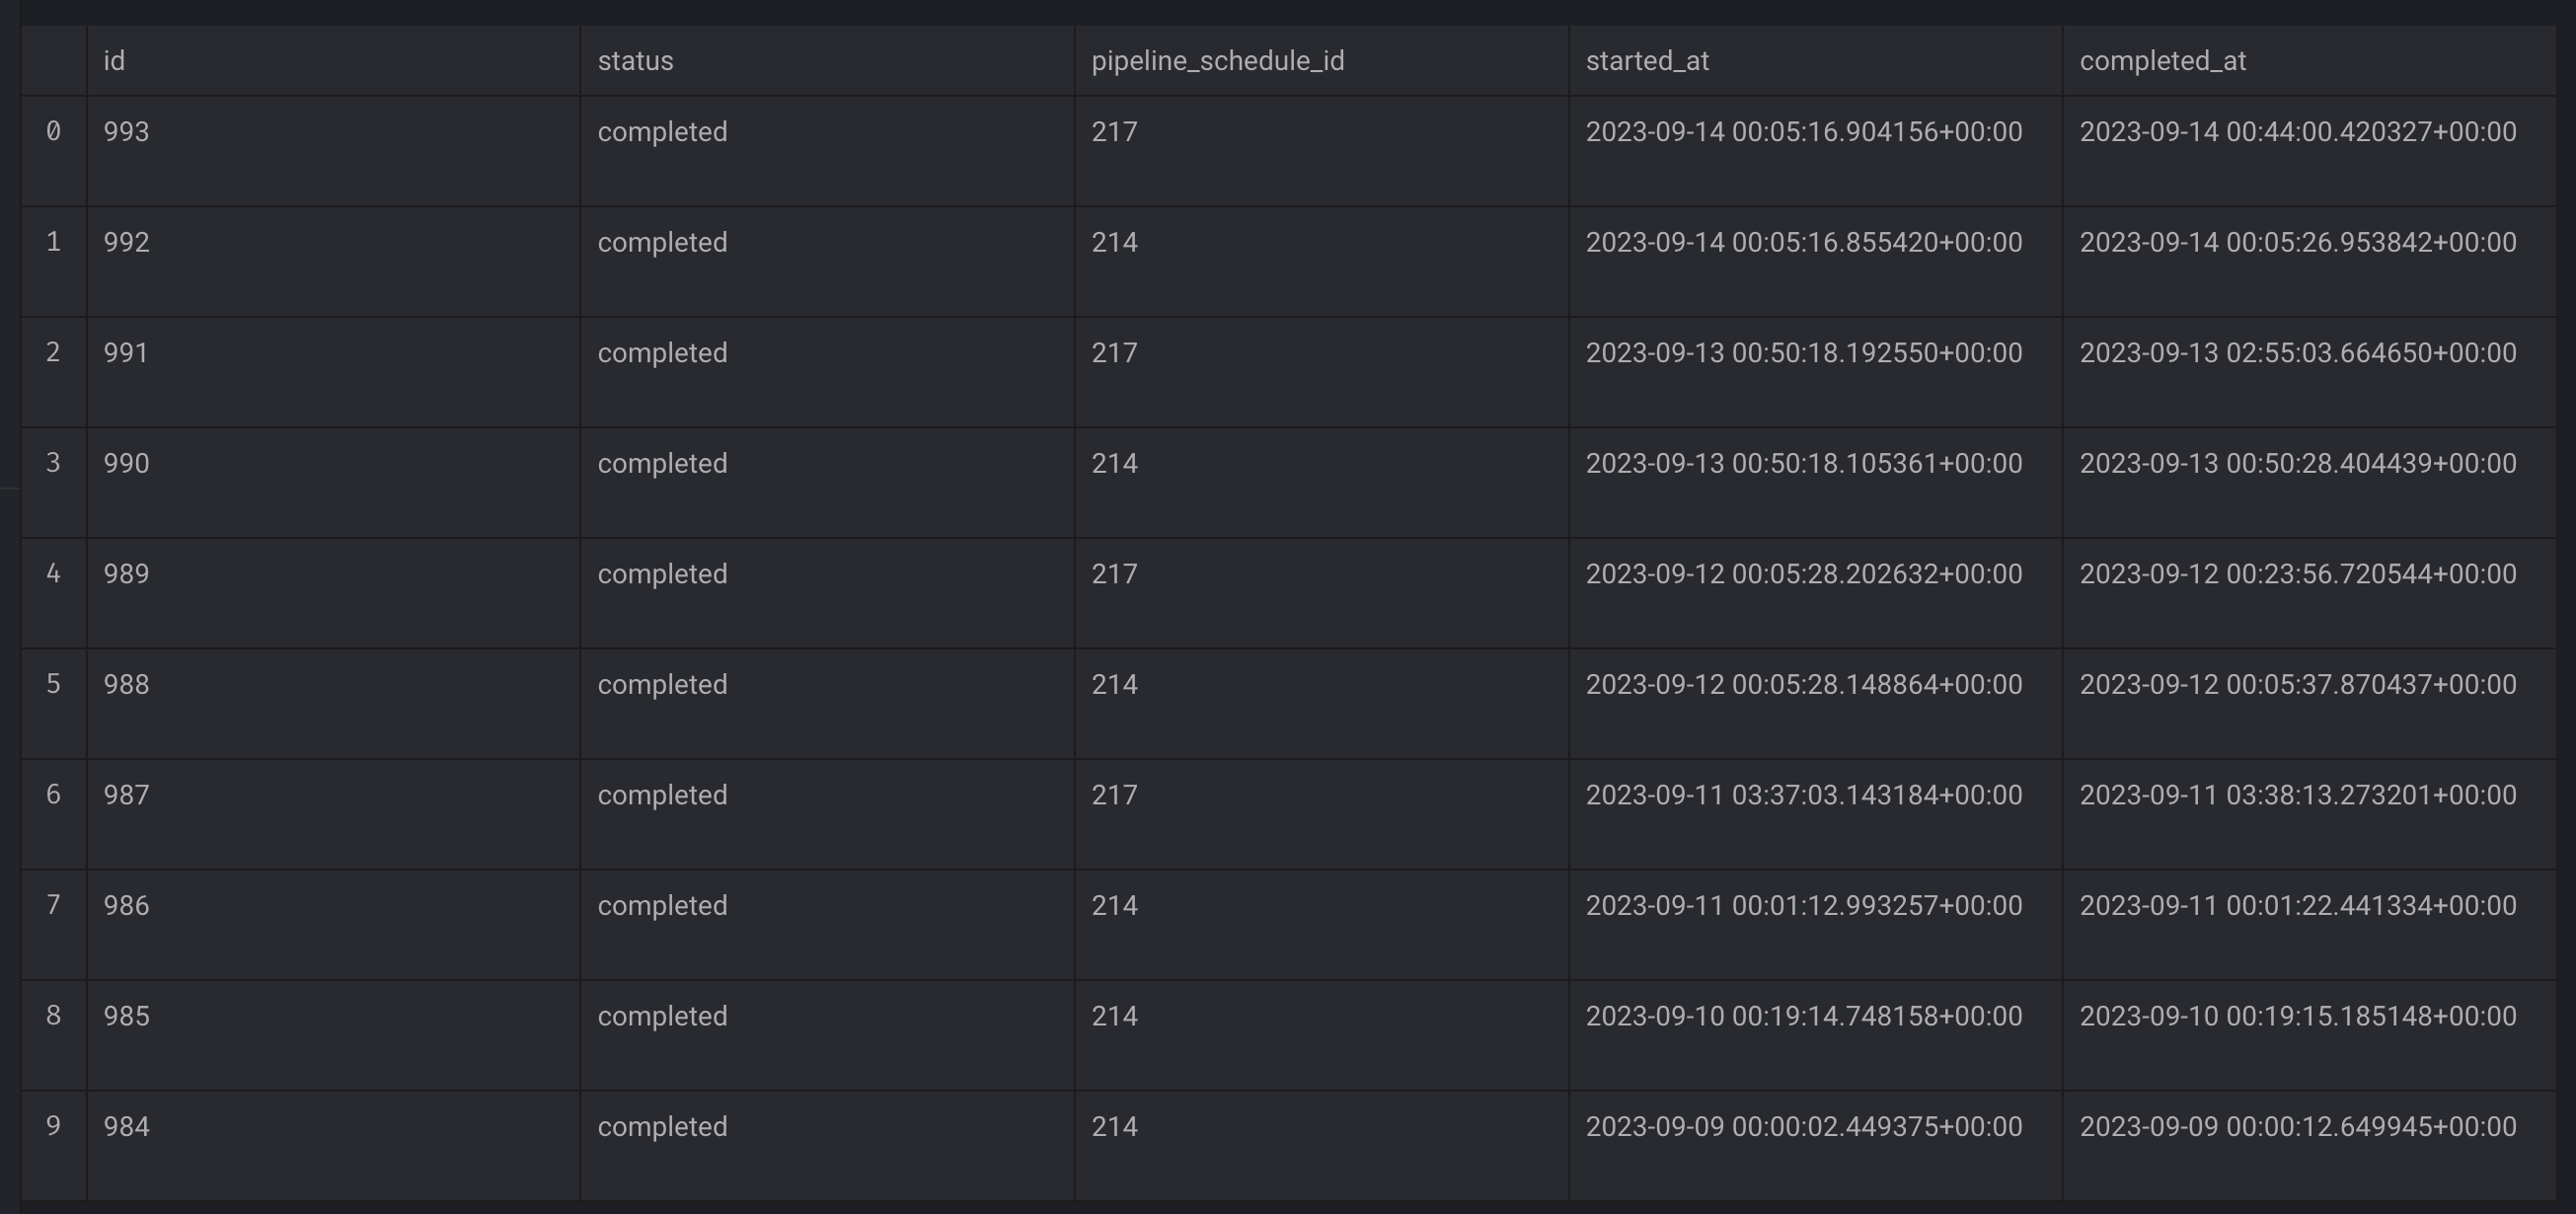
Table
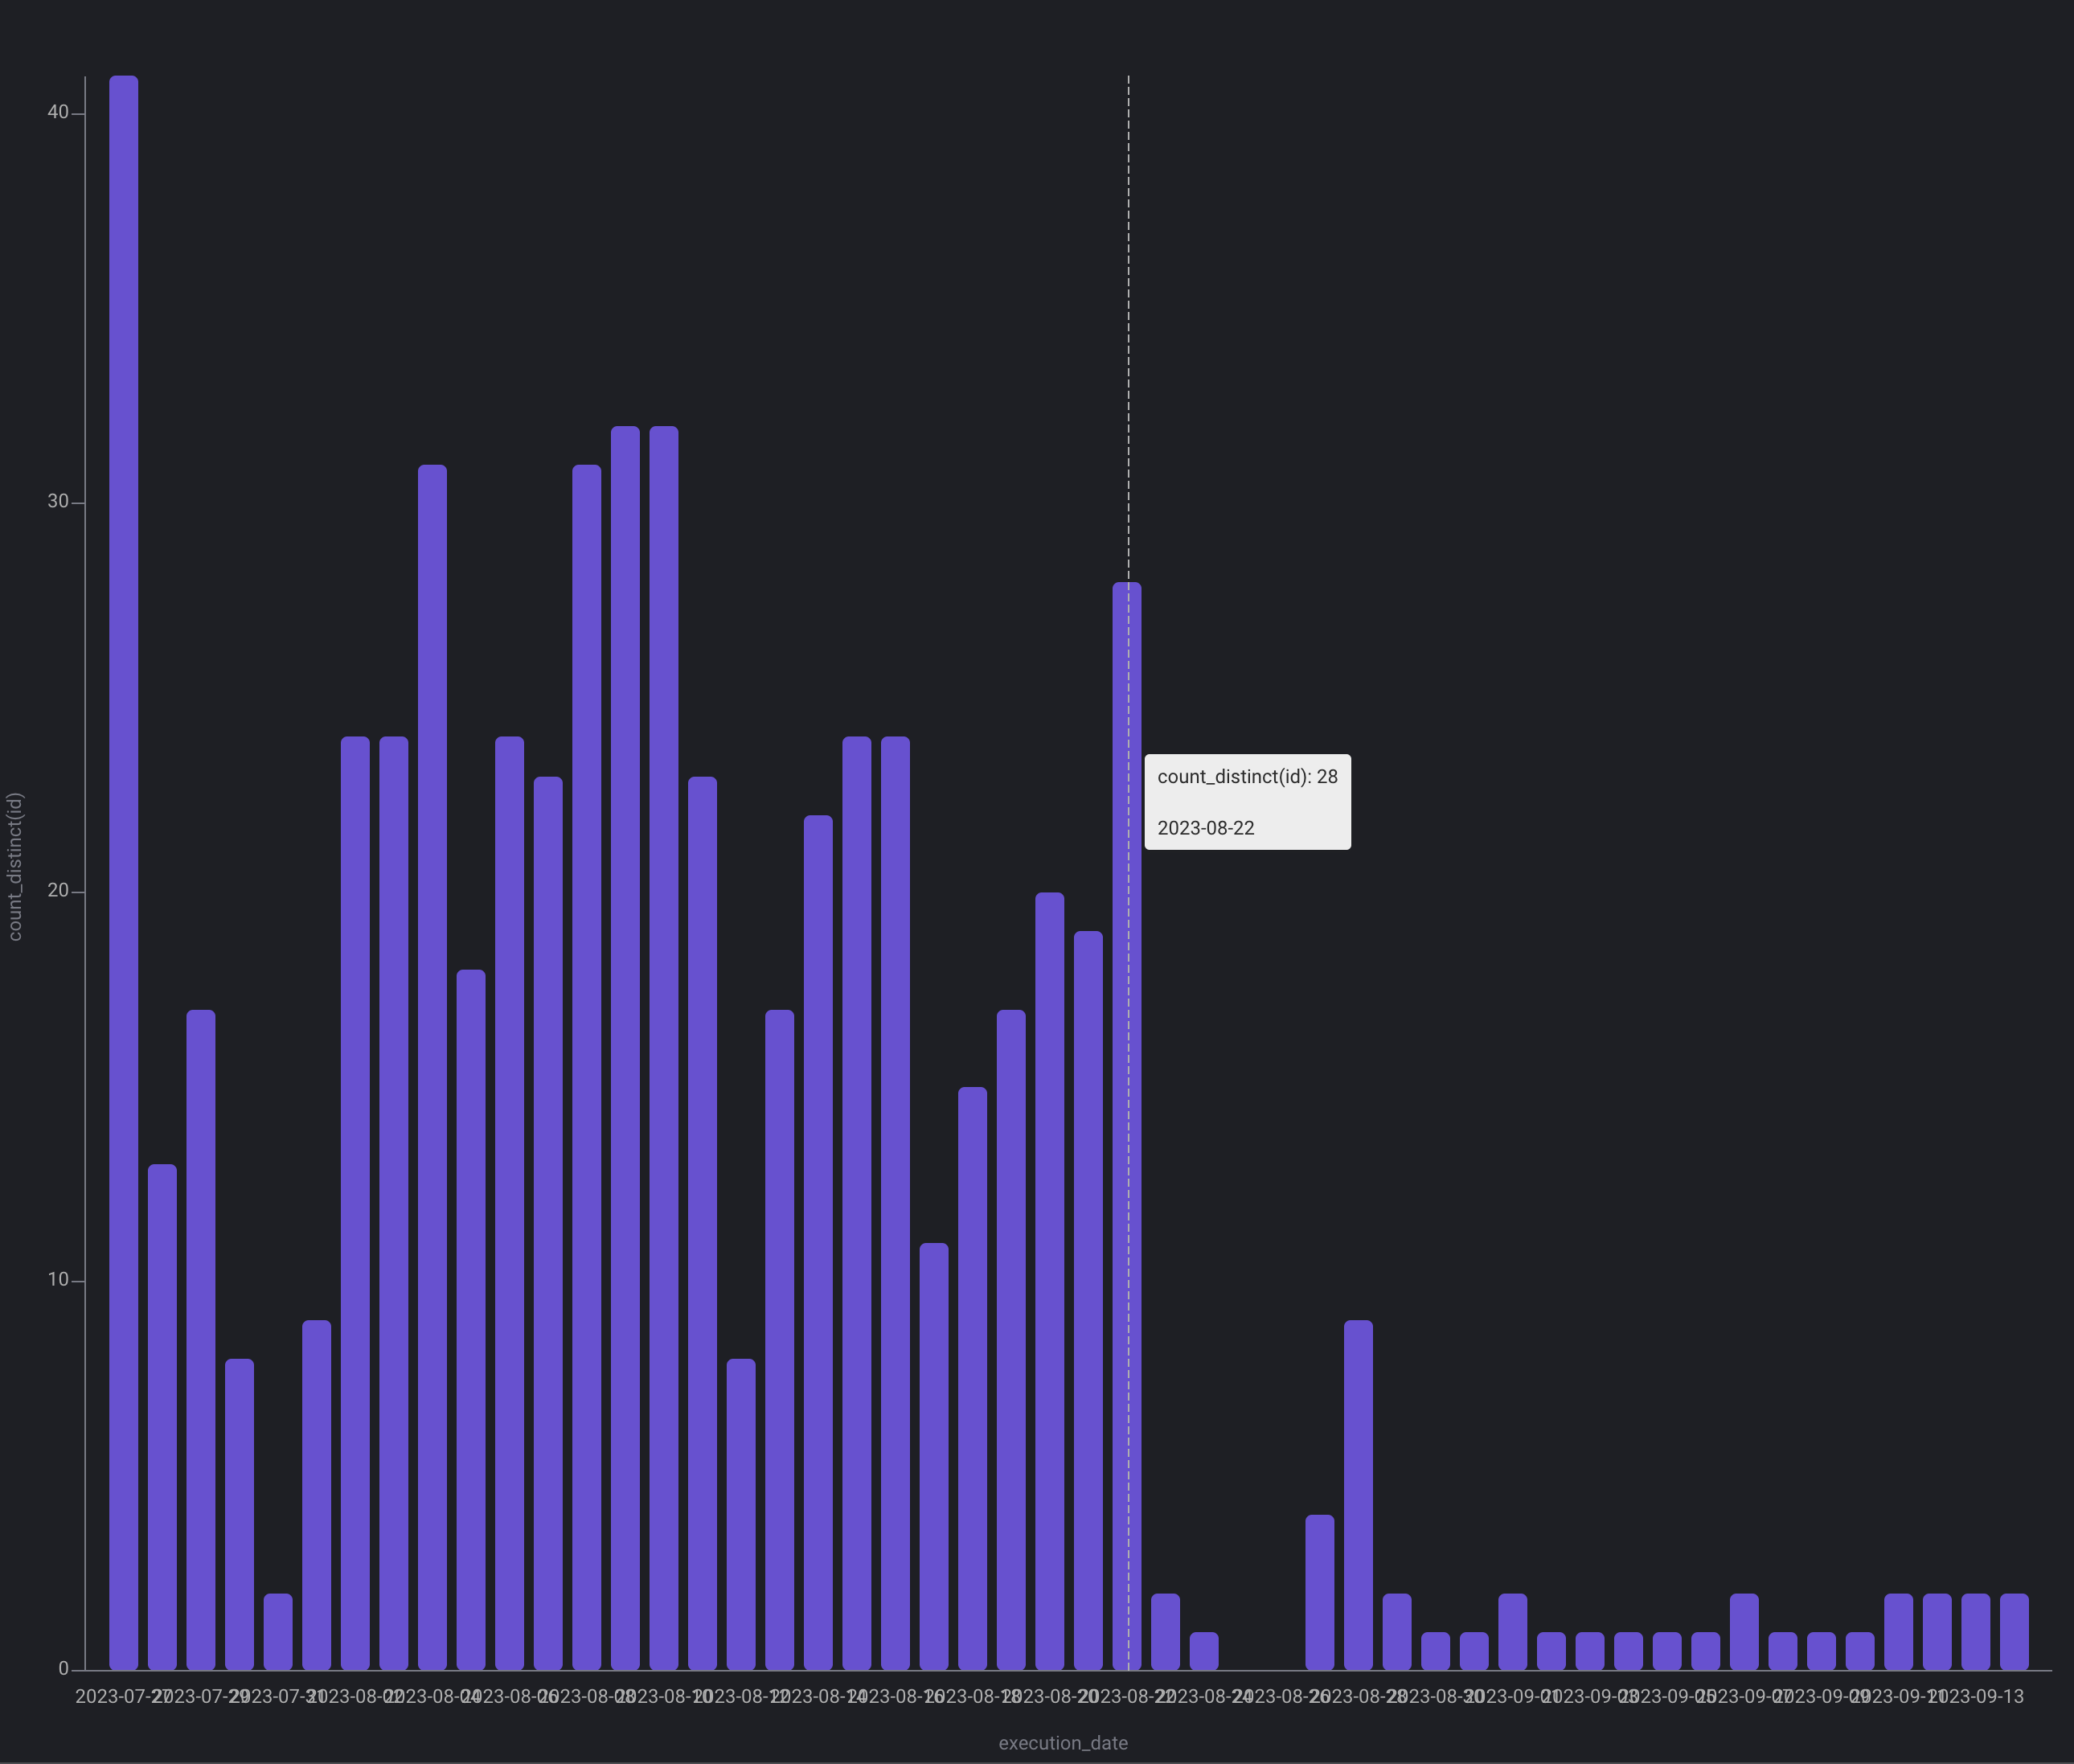
Time series bar chart
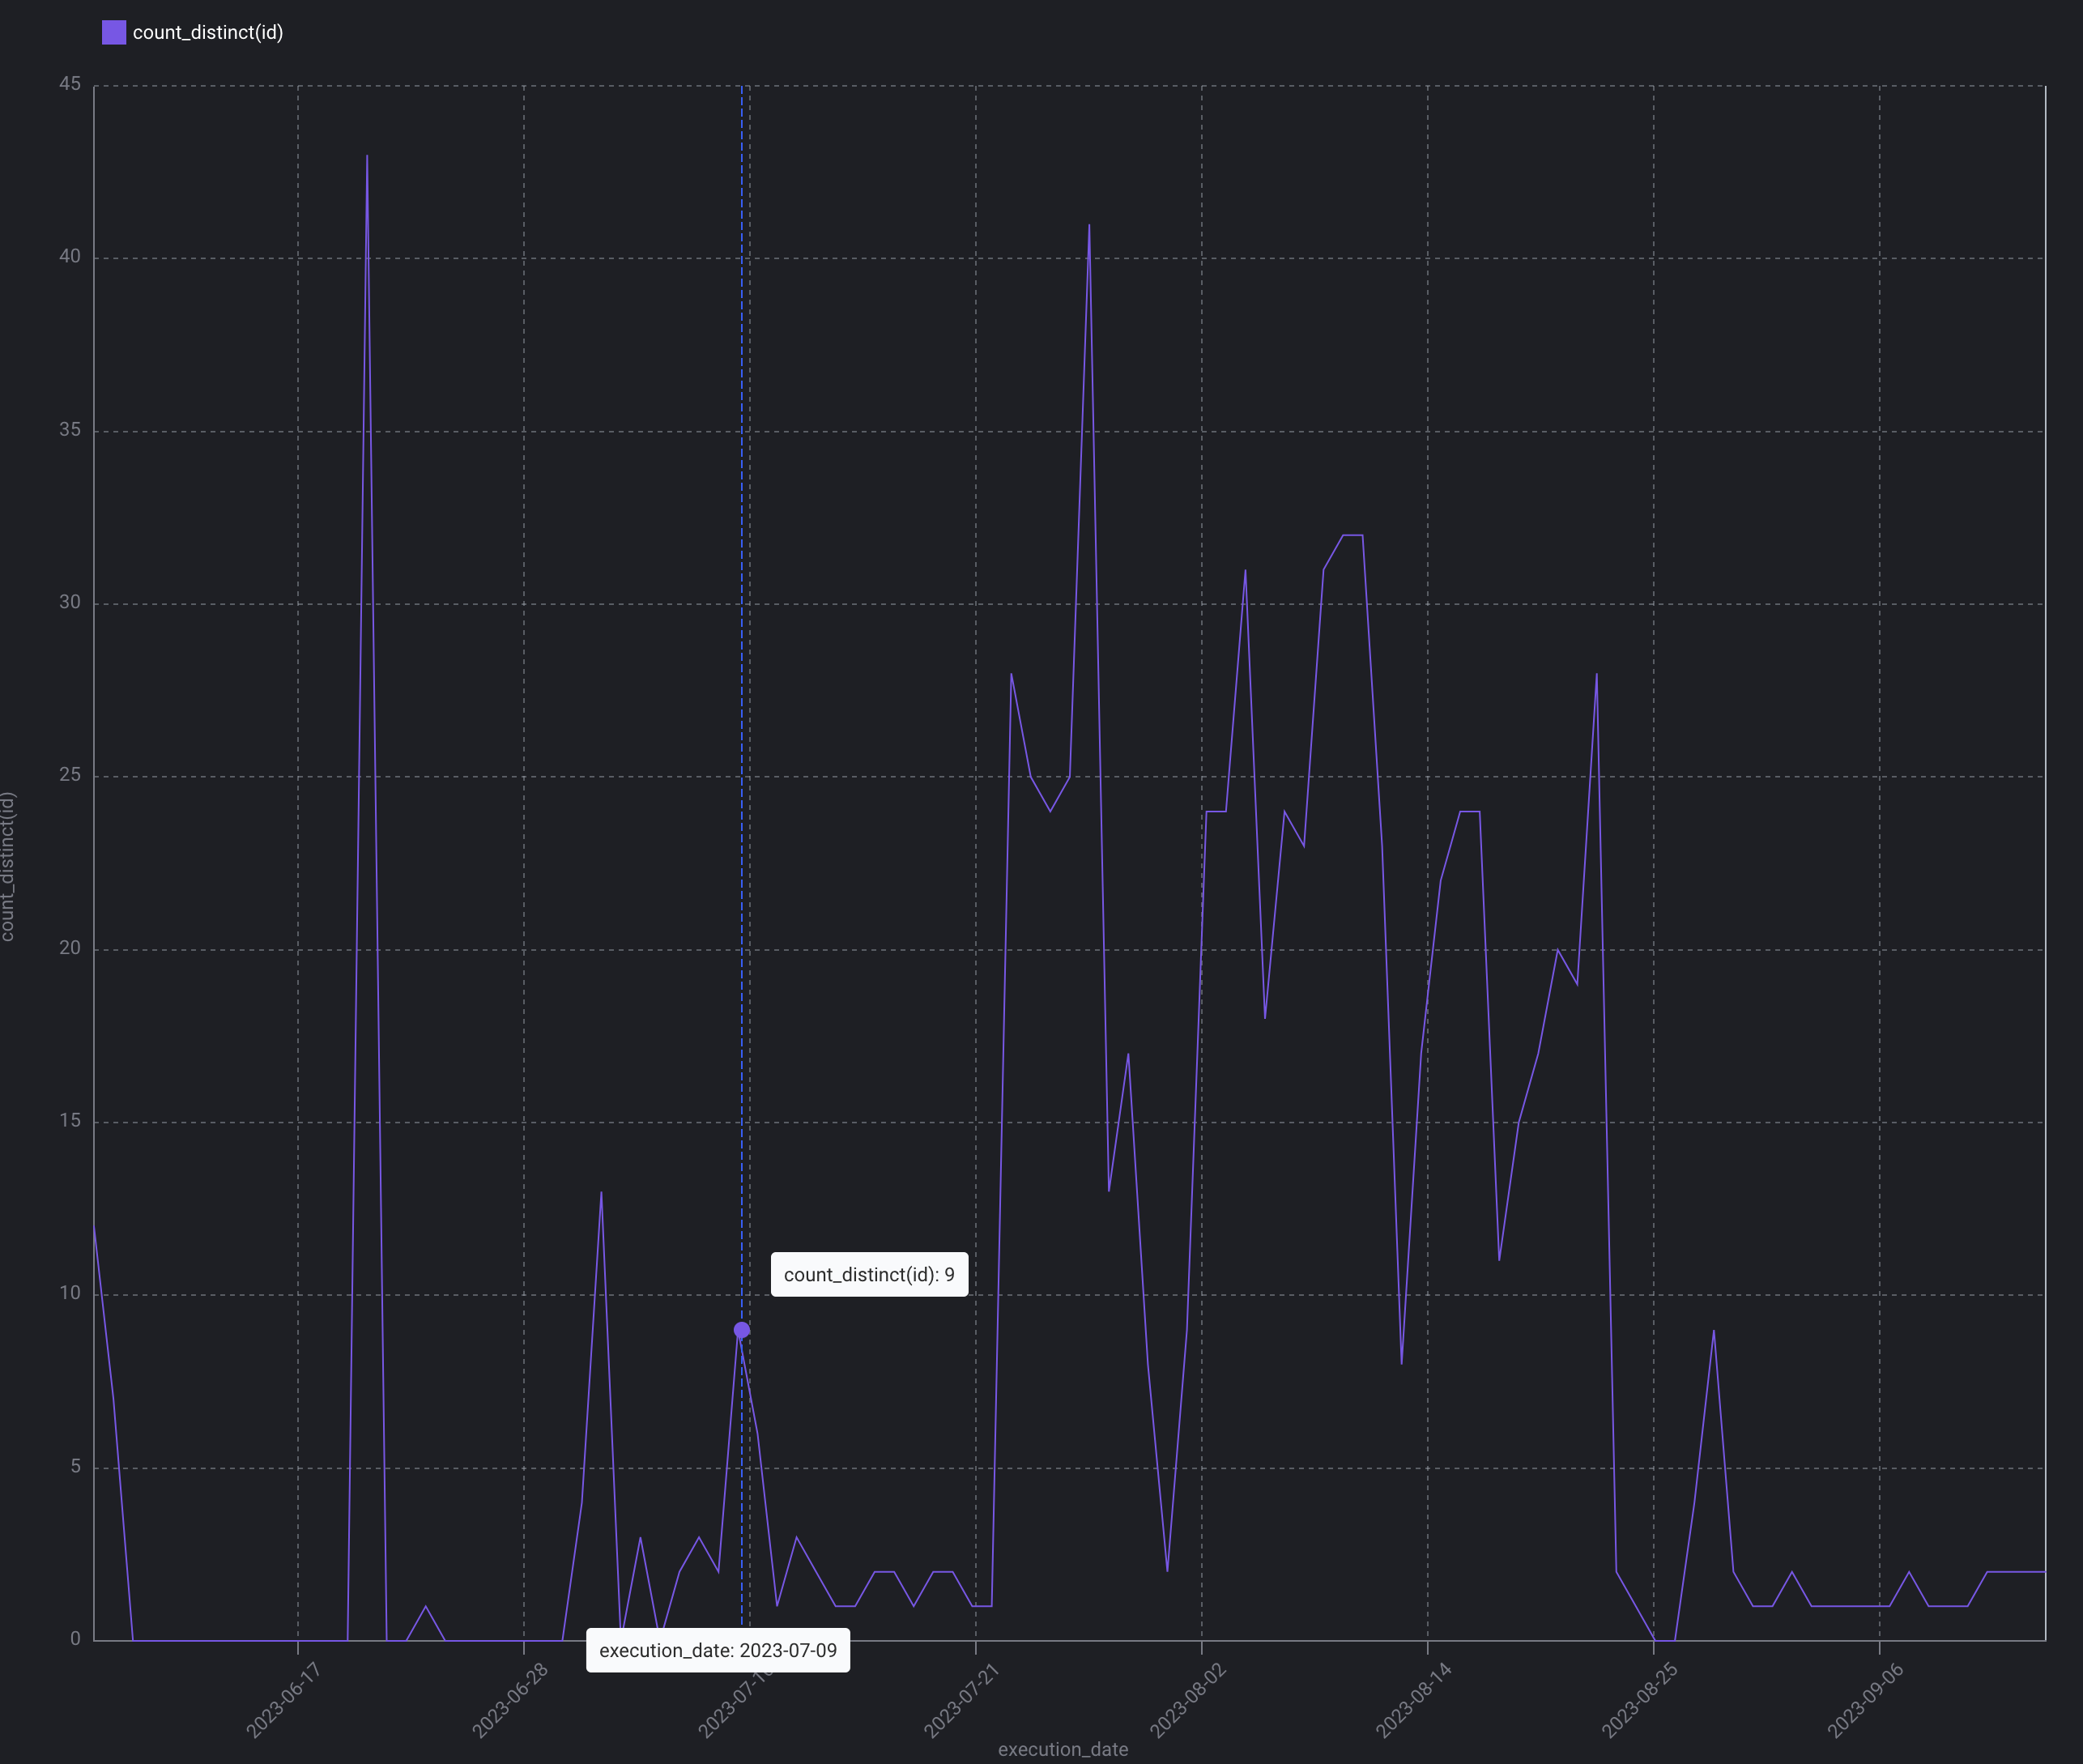
Time series line chart
Data source
A chart has at least 1 data source. In the near future, a chart can have more than 1 data source.Block data output (type)
Get the output data from a block in a specific pipeline.Block runs (type)
Get data from all block runs or all block runs from a specific pipeline.Custom code (type)
Define a function using the@data_source decorator that returns the data
for your chart.
Pipelines (type)
Get data from all pipelines.Pipeline runs (type)
Get data from all pipeline runs or all pipeline runs from a specific pipeline or all pipeline runs from a specific trigger.Triggers (type)
Get data from all triggers or all triggers from a specific pipeline.Refresh interval
How frequent do you want this chart to automatically fetch new data from its data source? Enter a number in milliseconds (e.g. 1000ms is 1 second).Chart display settings
Group by columns
Select the column to group your data by.Metrics
Chart style
Some charts have multiple styles of the same visualization.Sort direction
Some charts can sort the visualizations in ascending or descending order.Number of buckets or slices
You can limit the number of buckets or slices that are displayed for some charts.Time column
For the time series charts, you must choose which column contains the date or time value to group the data by.Time interval
For the time series charts, you can choose how granular the interval is between each date or time values in the time column. For example, you can display your time series data on a daily basis or annual basis.Custom code for chart
The following decorators can optionally be used to further customize your chart.@data_source
If the data source type is Custom code, then this function’s return value is the
data that the chart will display.
However, if the data source type is anything else besides Custom code,
then this function can be used for post processing of the data from the selected
data source.
For example, let’s say the data source type is Block data output and
the number of partitions is 2. The chart will retrieve the 2 most recent partitions of data from
that block.
In the @data_source decorated function, you can write code to operate on 2 of
those block output data:
@x
Write custom code to return the x values for your chart.
X values typically contain the column that you group your data on.
For example, group pipelines by their type.
@y
Write custom code to return the y values for your chart.
Y values typically contain the value for a group of rows.
For example, the number of pipelines that are data integration pipelines.
@xy
This function combines the purpose of @x and @y into 1 function.
Use this function if you want to custom both the x and y values and you want to share the
same variables defined within the function.
The difference is that you must return a tuple where
the x values are 1st and the y values are 2nd.